Chart Management Update
As the terminal expands, so too does the need to keep all elements with your chart organized. Today's chart management update provides a key quality of life improvement via the new dedicated 'Object Tree'. Fibonacci Retracetment drawing tool also arrives on MMT, alongside custom terminal theming, plus rendering and performance upgrades to the heatmap.
Object Tree
Following on from the Drawings Update a couple of weeks ago, today's major new addition is a dedicated Object Tree. This will provide you with a full breakdown of all elements within each respective Chart widget of current layout.
Each Chart widget will appear as a node within the Object Tree. The title of each node will reflect the market that has been selected for each respective chart. Clicking on this will reveal the panes that are used within the chosen chart. Note that 'Pane 0' is considered primary pane where price would be shown.
Clicking on each of the numbered panes will reveal all drawing plots and layers that are currently present. Here you can quickly 'Show / Hide' and 'Delete' each element within the respective pane. By default, Drawings are automatically placed above Layers and Indicator elements, which will be displayed at the bottom of the
We plan to expand the utility of the Object Tree in iterations. This will include standard functionality, including drawing 'Lock', nested folder management and customizable labelling for objects.
Improved Heatmap Performance
In last week's update, we discussed how changes in our approach to how MMT is built under the hood will increase the scope in which further improvements can be made. We are happy to announce that this has started paying dividends this week, with two major enhancements to Heatmap rendering performance.
Over the week, we've modified how we batch or chunk the heatmap data and respective rendering, enabling a nearly 4x improvement in rendering speed. The Heatmap's overall memory footprint has also been reduced by just over 25%. The combination of both increased rendering performance with reduced overall memory footprint ensures we maintain the buttery smooth MMT experience.
Fibonacci Retracement Drawing Tool
The recent drawing update was MMT's first iteration of our new approach to plotting a range of core drawing tools. One key staple was sorely missing however - Fibonacci Retracements. Pleased to share that this beloved tool has been shipped in this update.
Used most commonly between a low & high, the Fibonacci Retracement tool will render horizontal lines to determine potential support and resistance levels at key ratios derived from the Fibonacci sequence, such as 23.6%, 38.2%, and 61.8%.
Fibonacci Retracement Customization
As you'd expect there are a range of configuration options available within the Fibonacci Retracement drawing tool.
Display
The settings within this section will define how key elements of the Fibonacci Retracement are displayed. Toggles are provided to show or hide both the percentages and calculated prices of each defined Fibonacci ratios. Here you will also have the option to extend the render of each level indefinitely to the right, plus a toggle to display the trendline between the two chosen plot points.
Customizable Ratios
As you'd expect, you are free to enable or disable the rendering of a range commonly used pre-defined Fibonacci ratios. Within this section you are also able select a unique color for each level, in addition to the ability to delete ration entirely.
At the very bottom of the Fibonacci Retracement tool's menu is the ability to define your own custom ratios. Simply click the 'Add Level' button where you will be prompted to enter a value of your choice. Once entered, it will be displayed in numerical order alongside any predefined ratios.
Terminal Appearance Improvements
MMT is designed to be an integral tool as part of your workflow if trading or analyzing markets. In todays update we have freshened the UI with color added to key places for visual reference, in addition to subtle padding and placement changes to tighten the terminal's appearance as a whole.
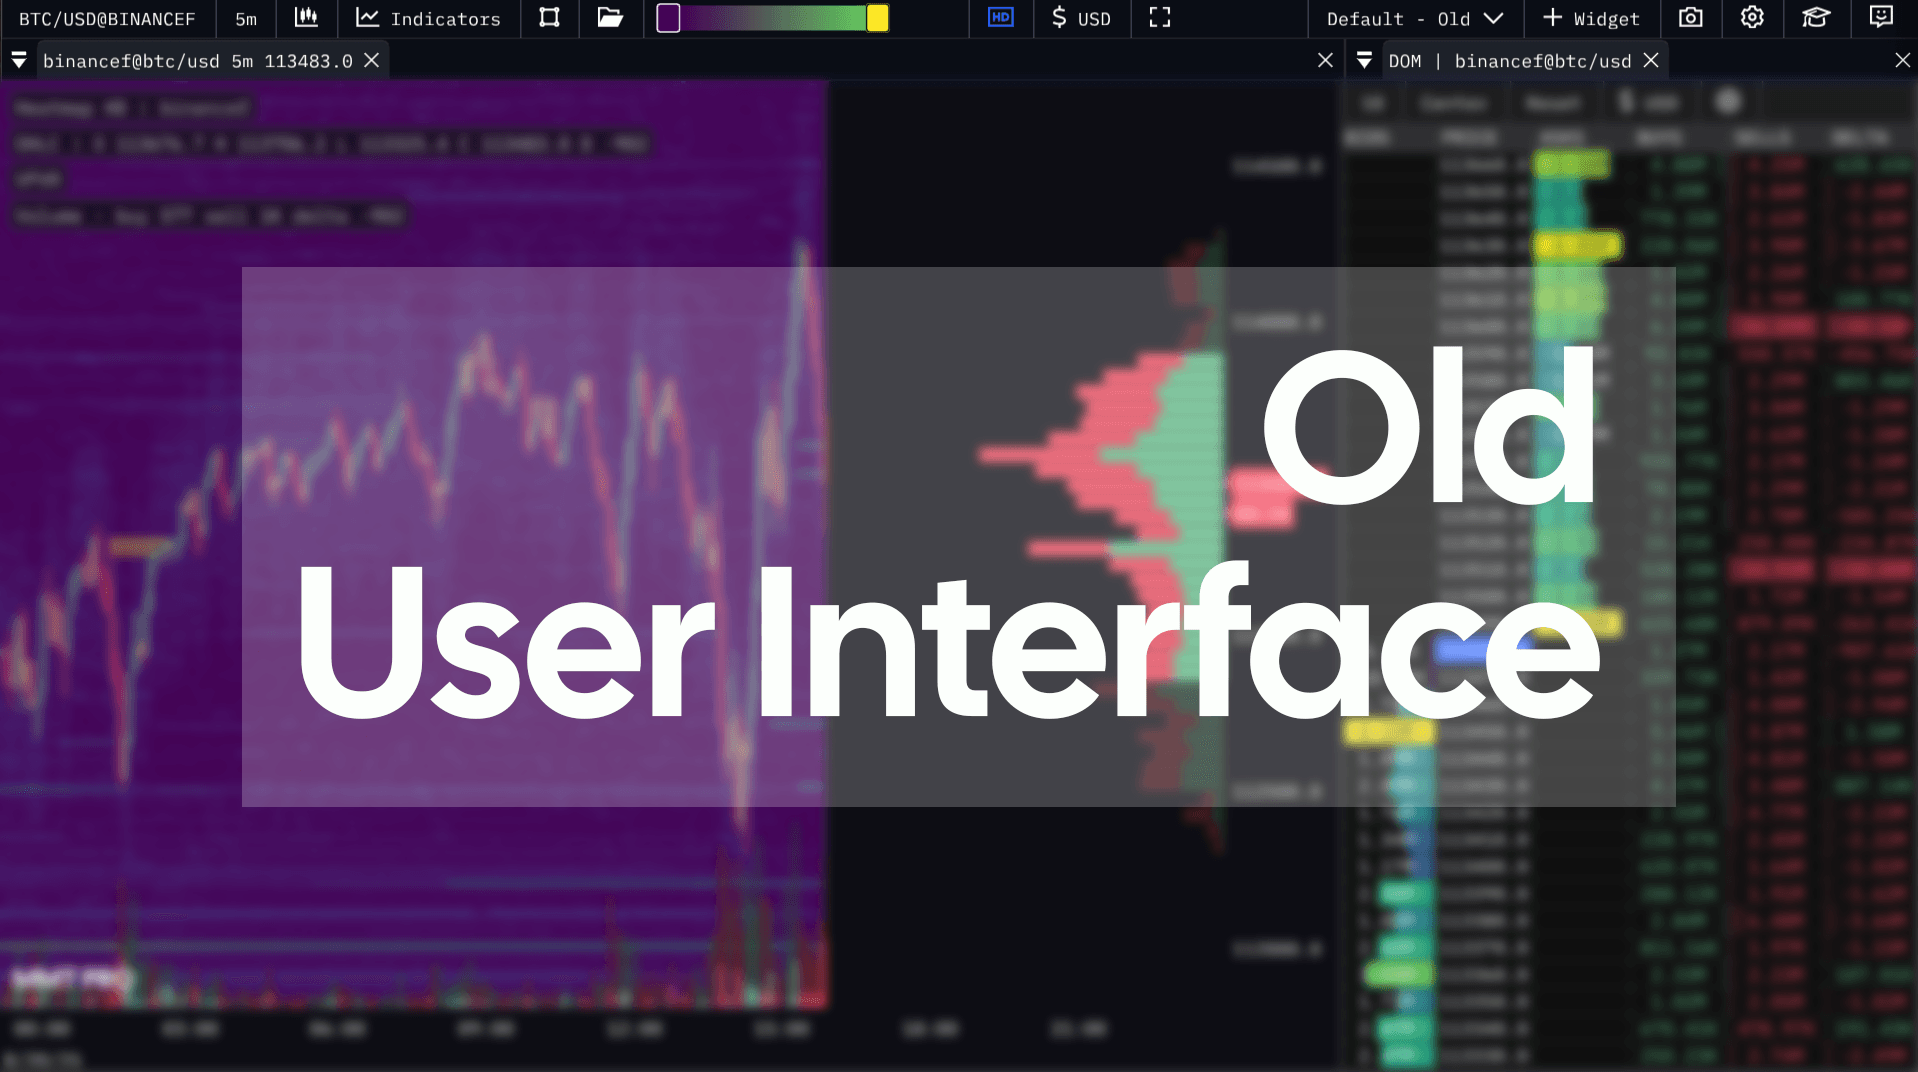
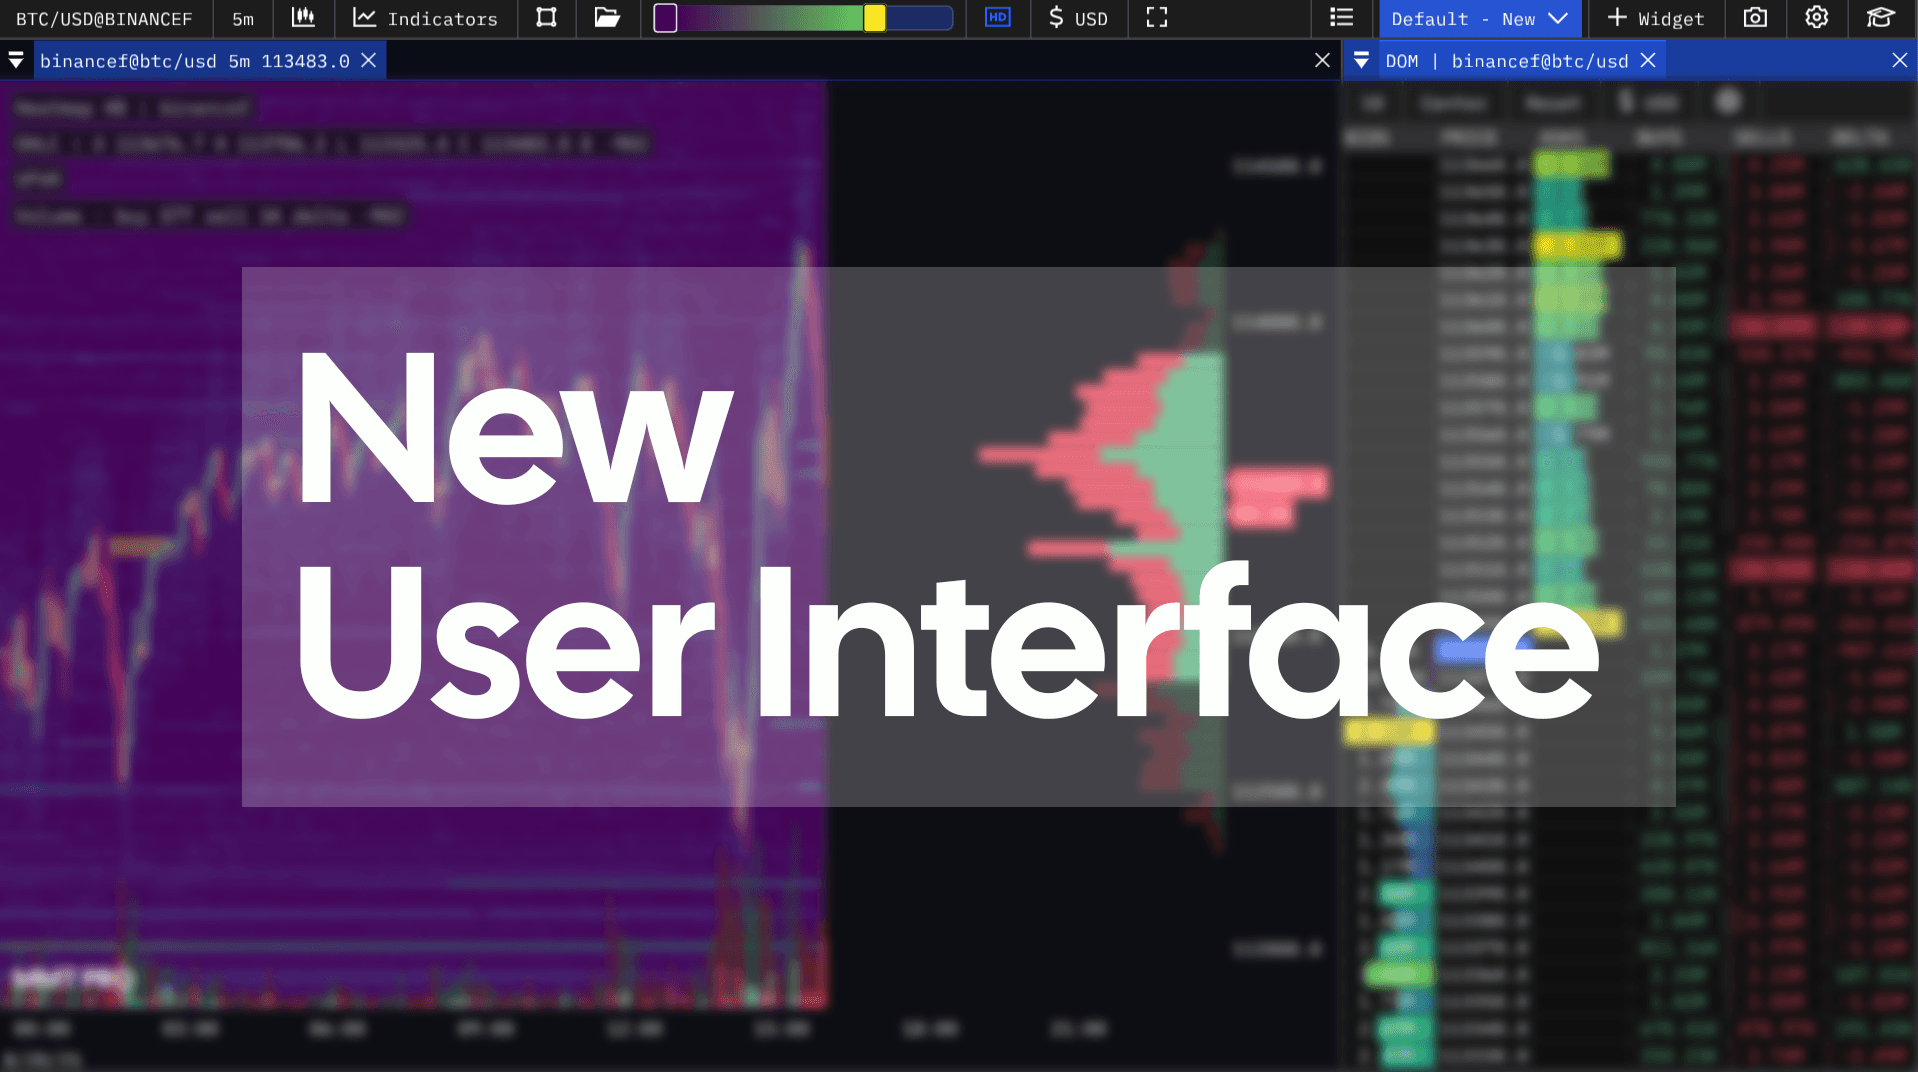
New UI vs Old UI
Custom Theme Accent
Those wishing to tweak the terminal styling to their own preferences now have the ability to do so via the new 'Theme Accent' option within the 'Settings' menu.
This accent is graded in various places throughout the UI to ensure styling uniformity regardless of your preferred color choice.
Minor Improvements/Bug Fixes
⭐️ Liquidation Feed - Each liquidation timestamp will be displayed in local time if enabled.
⭐️ Drawing State - Drawings are now saved between changing of pairs, providing the chart widget that possesses them is not deleted.
🐛 Heatmap & Liquidation Map Sliders - Fixed an issue whereby changing pairs at times resulted in Peak input being lower that the defined Min input
🐛 Layer State - The state of each layer within chart widgets will be saved between refreshes
Until next time,