Bar Statistics
Introduction
Depending upon the type of analysis you are performing, certain tools may be more suitable over others. Analysis conducted with particular tools on a high time-frame, is unlikely to be of the same value when applied to an ultra low time-frame, and vice versa.
One exception to this is MMT's Bar Statistics which provides a great visual method to quickly analyze key market data points over a wide range of candles, regardless of the time-frame selected.

Bar Statistic Elements
When activated, Market Monkey's Bar Statistics tool is visually rendered as a table underneath your chart. This table prints key data points as a color-graded cells, enabling you to quickly and efficiently compare raw values visually. Bar statistics is a particularly versatile tool in this regard, providing extreme value regardless of your selected timeframe.
Let's explore each element of MMT's Bar Statistics layer.
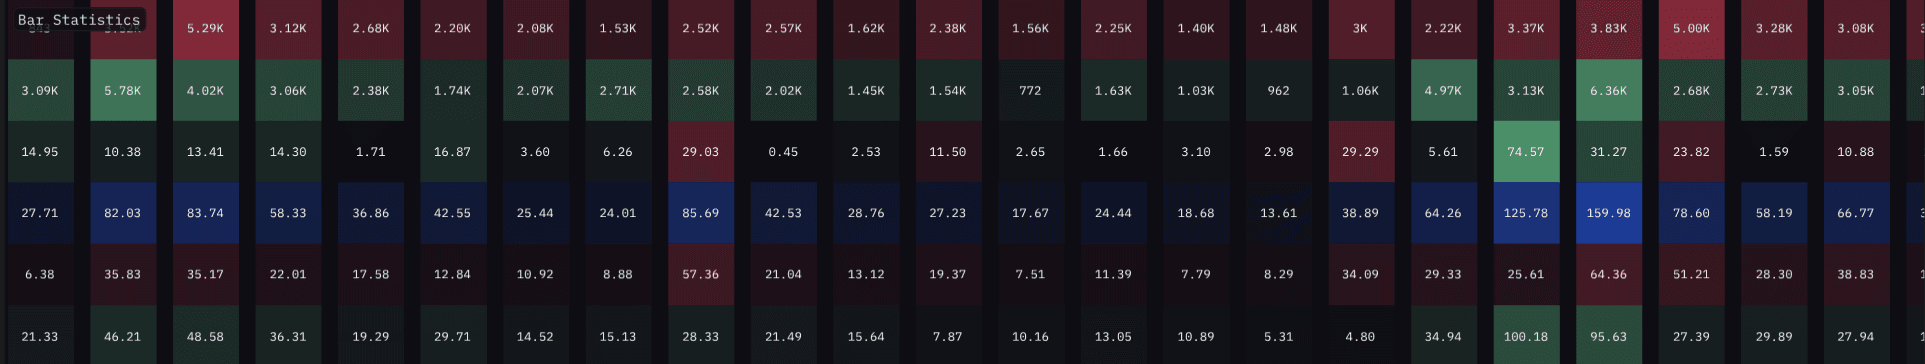
Each row of the table represents a single data point over time.
Each cell within each respective row, is the raw data point recorded for its associated candle. Each cell's value is compared with all other values within its row and subsequently given a color grading.

As each cell for each respective row is 'stitched-together' often patterns of flow can be witnessed. Although perhaps not forming the entire thesis for a trading decision of itself, the visual cues offered by MMT's Bar Stats can often provide an additional layer of confluence for other analysis. Another common use of Bar Statistics is when wishing to examine flow with precise detail.

Traders seeking a confirmation via raw data points can utilize Bar Statistics to view detail, both historical and live market metrics, side-by-side. This is crucial in highly-volatile, fast-moving markets, as no additional input or movement is required by the trader to compare market data between candles.
Bar Statistic Rows
Buy Volume
Total value of Market Buy volume.
Sell Volume
Total value of Market Sell volume.
Total Volume
Total value of Market Buy & Market Sell volume.
Delta Volume
The delta of Market Buy & Market Sell volume.
Buy Trades
Total recorded number (or count) of Market Buy orders.
Sell Trades
Total recorded number (or count) of Market Sell orders.
Activating Bar Statistics
To activate Bar Statistics, navigate to the top of the selected chart; 'Indicators' → 'Bar Stats'
Configuring Bar Statistics
Given the range of data available within the MMT Bar Statistics tool, there are a number of configuration options to consider.
Grading
This is a key configuration option that can radically modify the Bar Statistics color grading calculation. Given this we willl explore each option in a little further detail.
Each cell within each row will be color graded using one of the following methods:
Individual
This will segregate each candles' data from one another. Other than grading between the rows underneath, no grading calculation is perfromed across other candles.
Daily
All data points collected since the start of the daily session - 00:00 until 23:59 (UTC)
Weekly
All data points collected since the start of the daily session - Every Monday at 00:00 until Sunday at 23:59 (UTC)
Visible Range
All data points currently within view on you chart. As you pan the chart, the calculation it re-applied on the fly.
Whole Chart
All data points that are loaded within your terminal's history. The more historical data that you examine, the wider the calculations range - notably this is regardless if of whichever candles are currrently visible on your chart.
Toggle
Each data metric with Bar Statistics can be toggled as per your requirements. The height of the rows automatically expand and contract depending upon which rows you have enabled.
Color Picker
Similarly to the toggle, each row has its own color picker. Not when changing modifying, the color selected here will be the 'brightest' possible a cell within that particular row. All MMT calculated grading will use your chosen color as it's base.