TPO Market Profile
Introduction
Profiles are used to assess market data between price levels. Analyzing data horizontally allows you to assess how participant within the market interact at key price levels. For example, tools such as Market Monkey's VPSV and VPVR are used to assess the distribution of market order volume between these price levels. In such examples the width of each row is determined primarily by the total value of market orders at each price level.
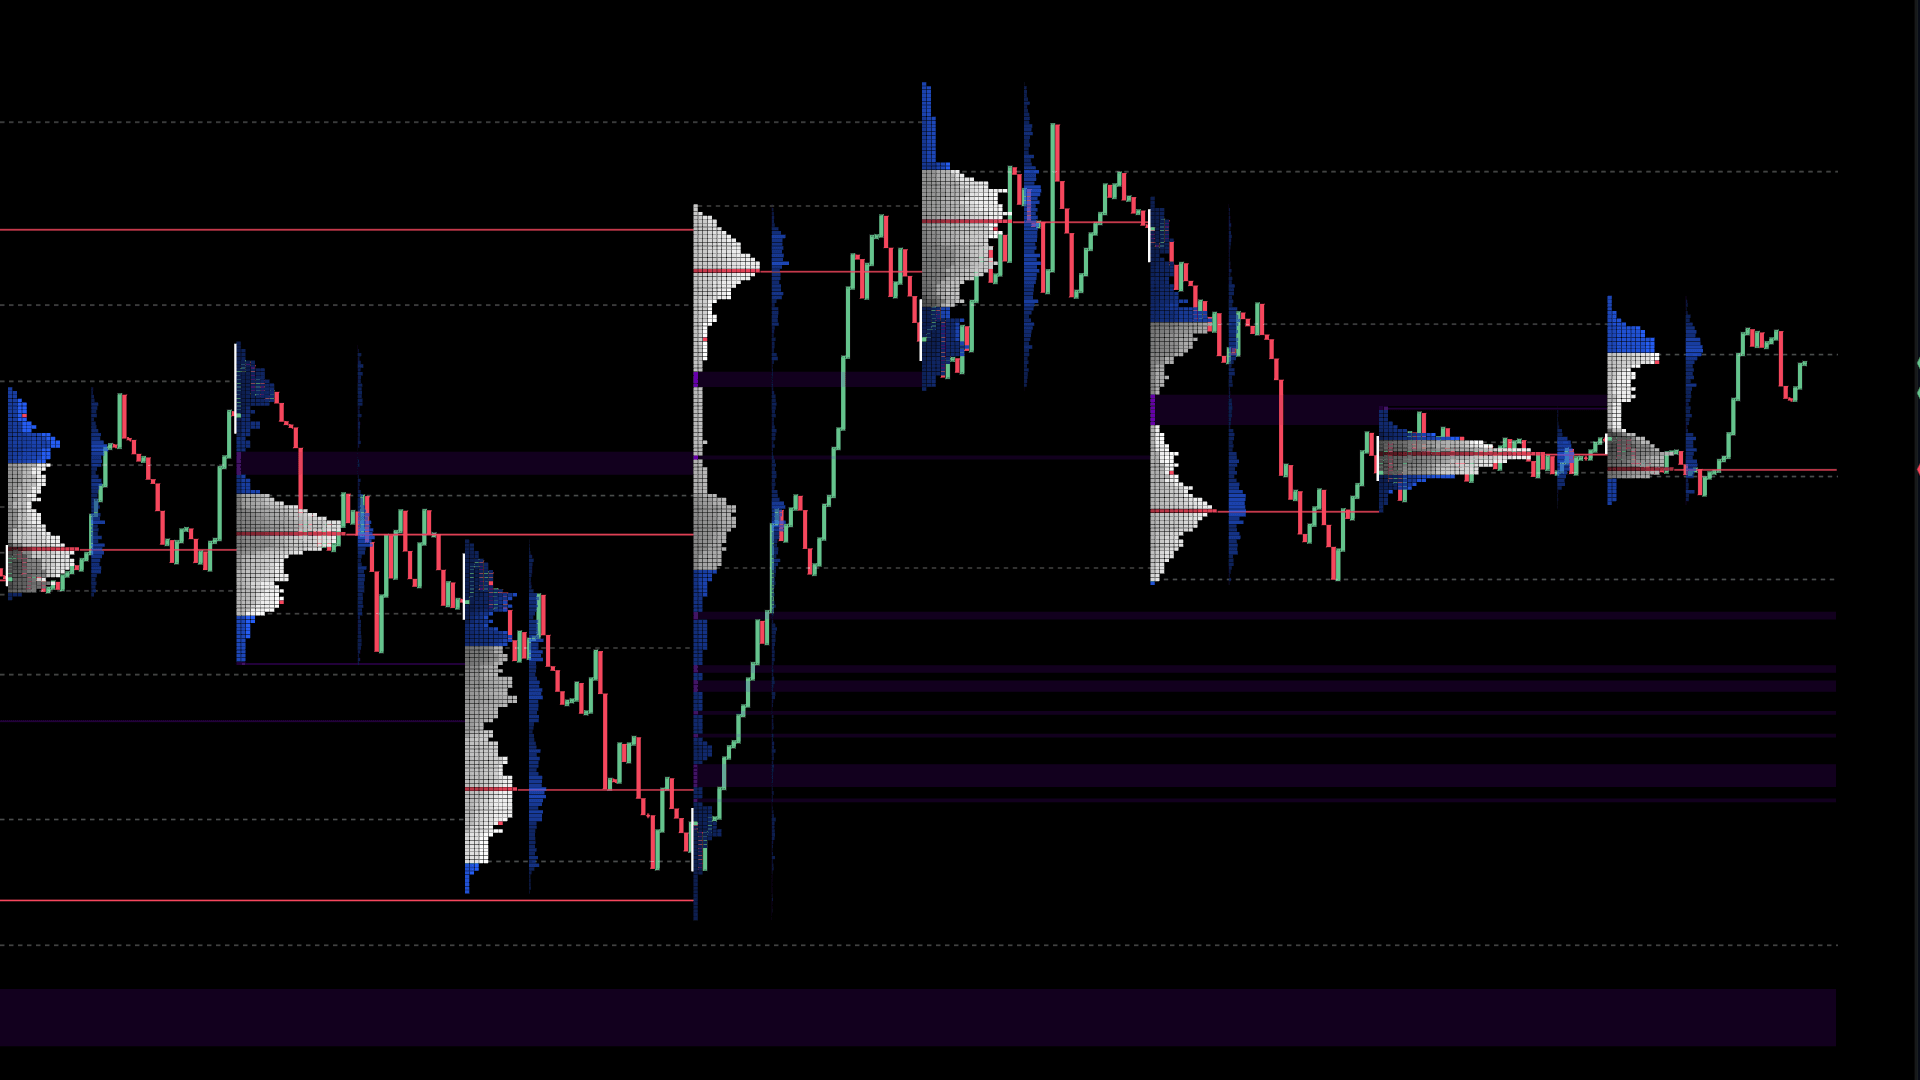
In comparison, TPO (Time Price Opportunity) or Market Profile charts visually display as a profile the distribution of time over these price levels. Conventionally TPO, uses a 30m timeframe to assess over a period of a defined trading 'session' (cryptocurrency markets; 24h). This distribution of time as a profile can often provide signal areas of interest for future price action. In this article, we will explain each element of Market Monkey's TPO / Market Profile Tool.
TPO Elements
Steidlmayer, the creator of the concept of TPO charts, originally instructed that a 30 minute timeframe should be used in the underlying construction of each TPO profile. All examples explained within this article will similarly use the 30 minute timeframe.
TPO Profile Construction
Trading Session
Each TPO profile assesses the distribution of time over various price levels, within one single trading 'session'. In trad-fi or legacy markets, a 'session' would usually be defined as the period between market open and market close. Within cryptocurrency markets, that do not have defined trading hours, a 'session' is primarily defined as the 24h period starting and ending at 00:00 UTC.
Block Assignment
After defining the trading 'session', we can divide the session into 30 minute intervals.
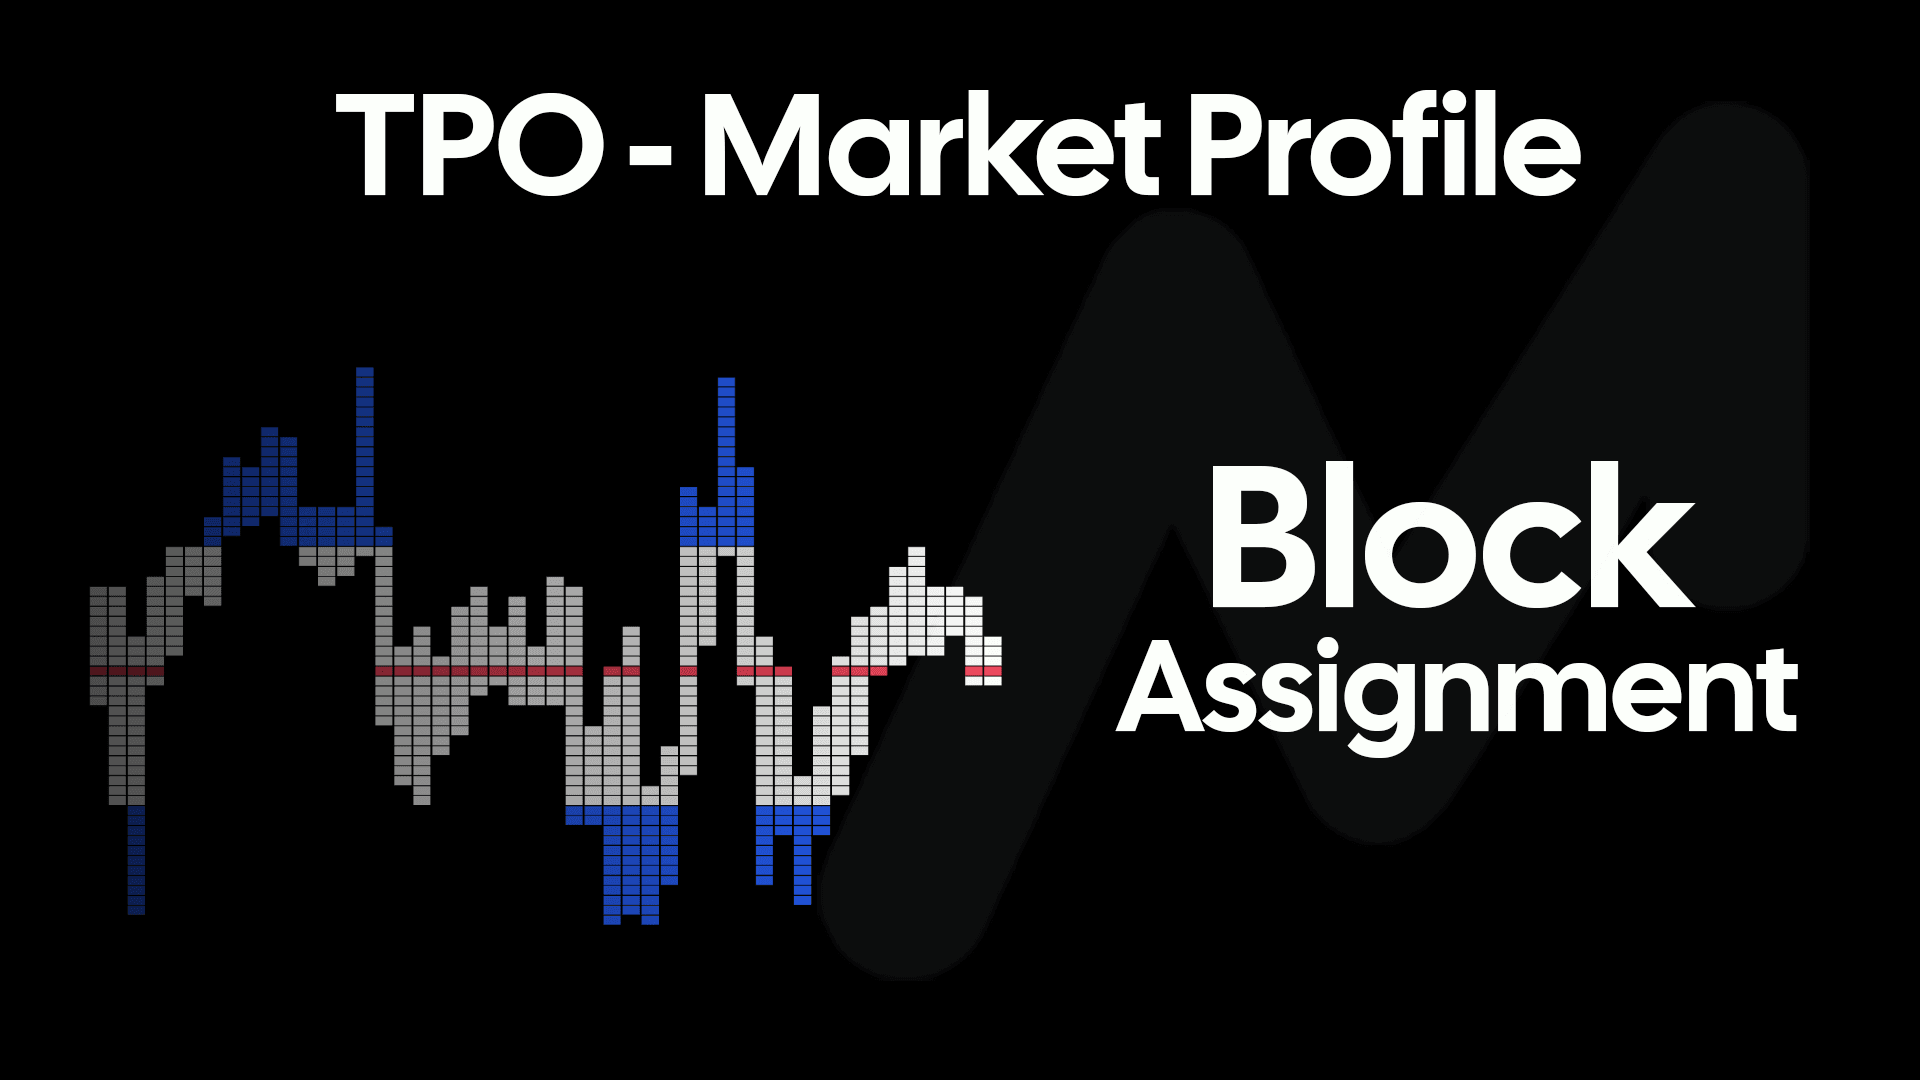
During each of these 30 minute intervals, the levels in which price traded are recorded and assigned a 'block'. Each group of blocks represent one of these 30m intervals.
Profile Formation
To create the TPO Profile itself, these blocks are subsequently stacked horizontally to the left, originating at the start of the trading 'session'. This distribution of the horizontally stacked blocks creates the TPO Profile.

The wider the row within the TPO Profile, the greater the number of 30 minute intervals price traded at that particular level. Once the blocks have been distributed to create a profile for a trading 'session', key elements and price levels can be calculated.
Point of Control
The Point of Control represents the level in which price traded most frequently within each 30 minute interval. This is shown as the widest row within the profile.
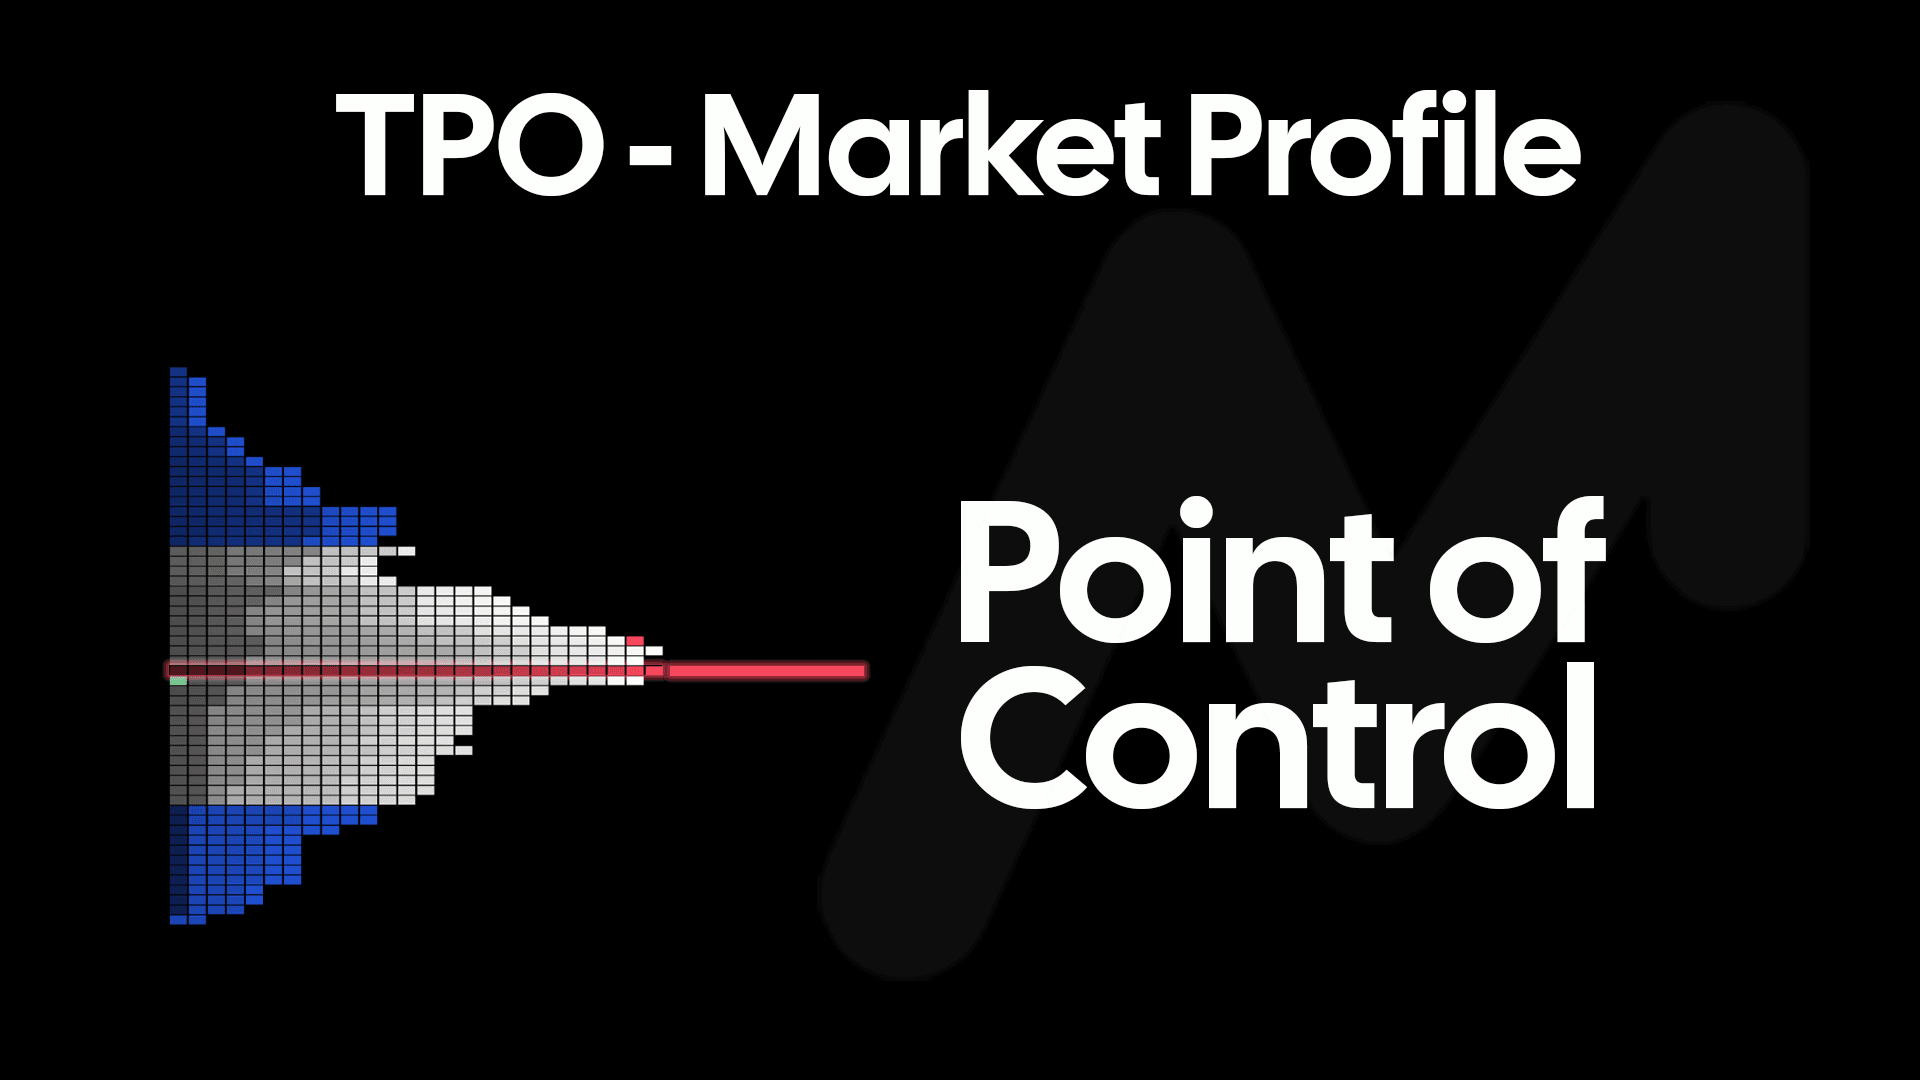
At times the distribution may result in multiple large rows of equal width. When this occurs, the row closest to the mid-point (defined as the price 50% in between the high and low of the trading 'session') of the profile. By default this Point of Control is shown within the Market Monkey Terminal as a red row, with an additional optional ray extending to the right, labeled 'POC'.
Value Area
Traditionally the Value Area is defined as the range in which 68% of the total distribution of all blocks within the profile occurred. After determining the Point of Control, the Value Area can be calculated. Originating from the Point of Control, each row above and below is compared to determine which possesses greater number of blocks.
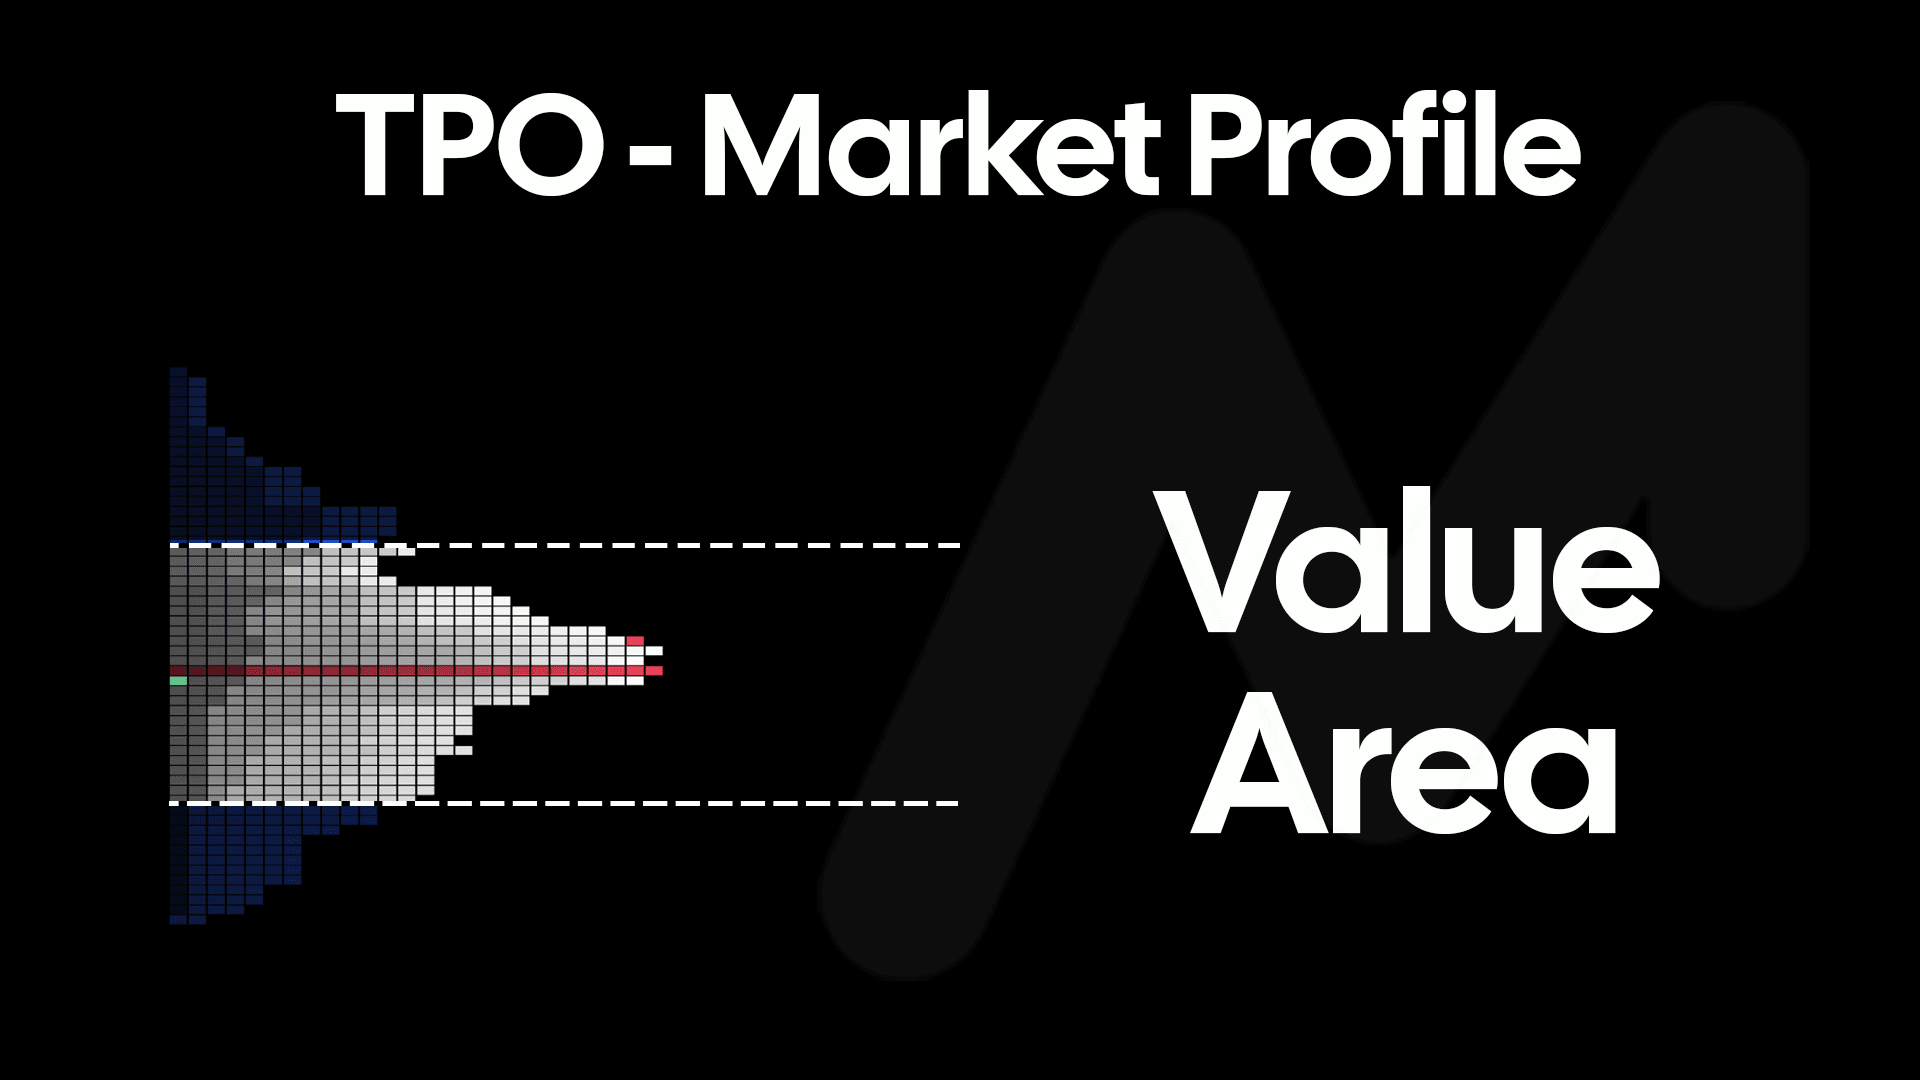
This process continues, expanding outwards from the POC until 68% of the total blocks have been accounted for. This defined range in which 68% of the blocks were distributed is considered the Value Area. The top of this range is usually referred to as the Value Area High (VAH), with the bottom of this 68% range referred to as the Value Area Low (VAL). Within MMT, the Value Area and all blocks within are shown in white. In addition both defined Value Area High and Value Area Low prices are respectively show as dashed rays.
Initial Balance
The initial balance is defined as the first two intervals or periods within the defined trading 'session'. Traditionally this would be the range of the distribution within the first hour of trading = 2 x 30 minute periods.
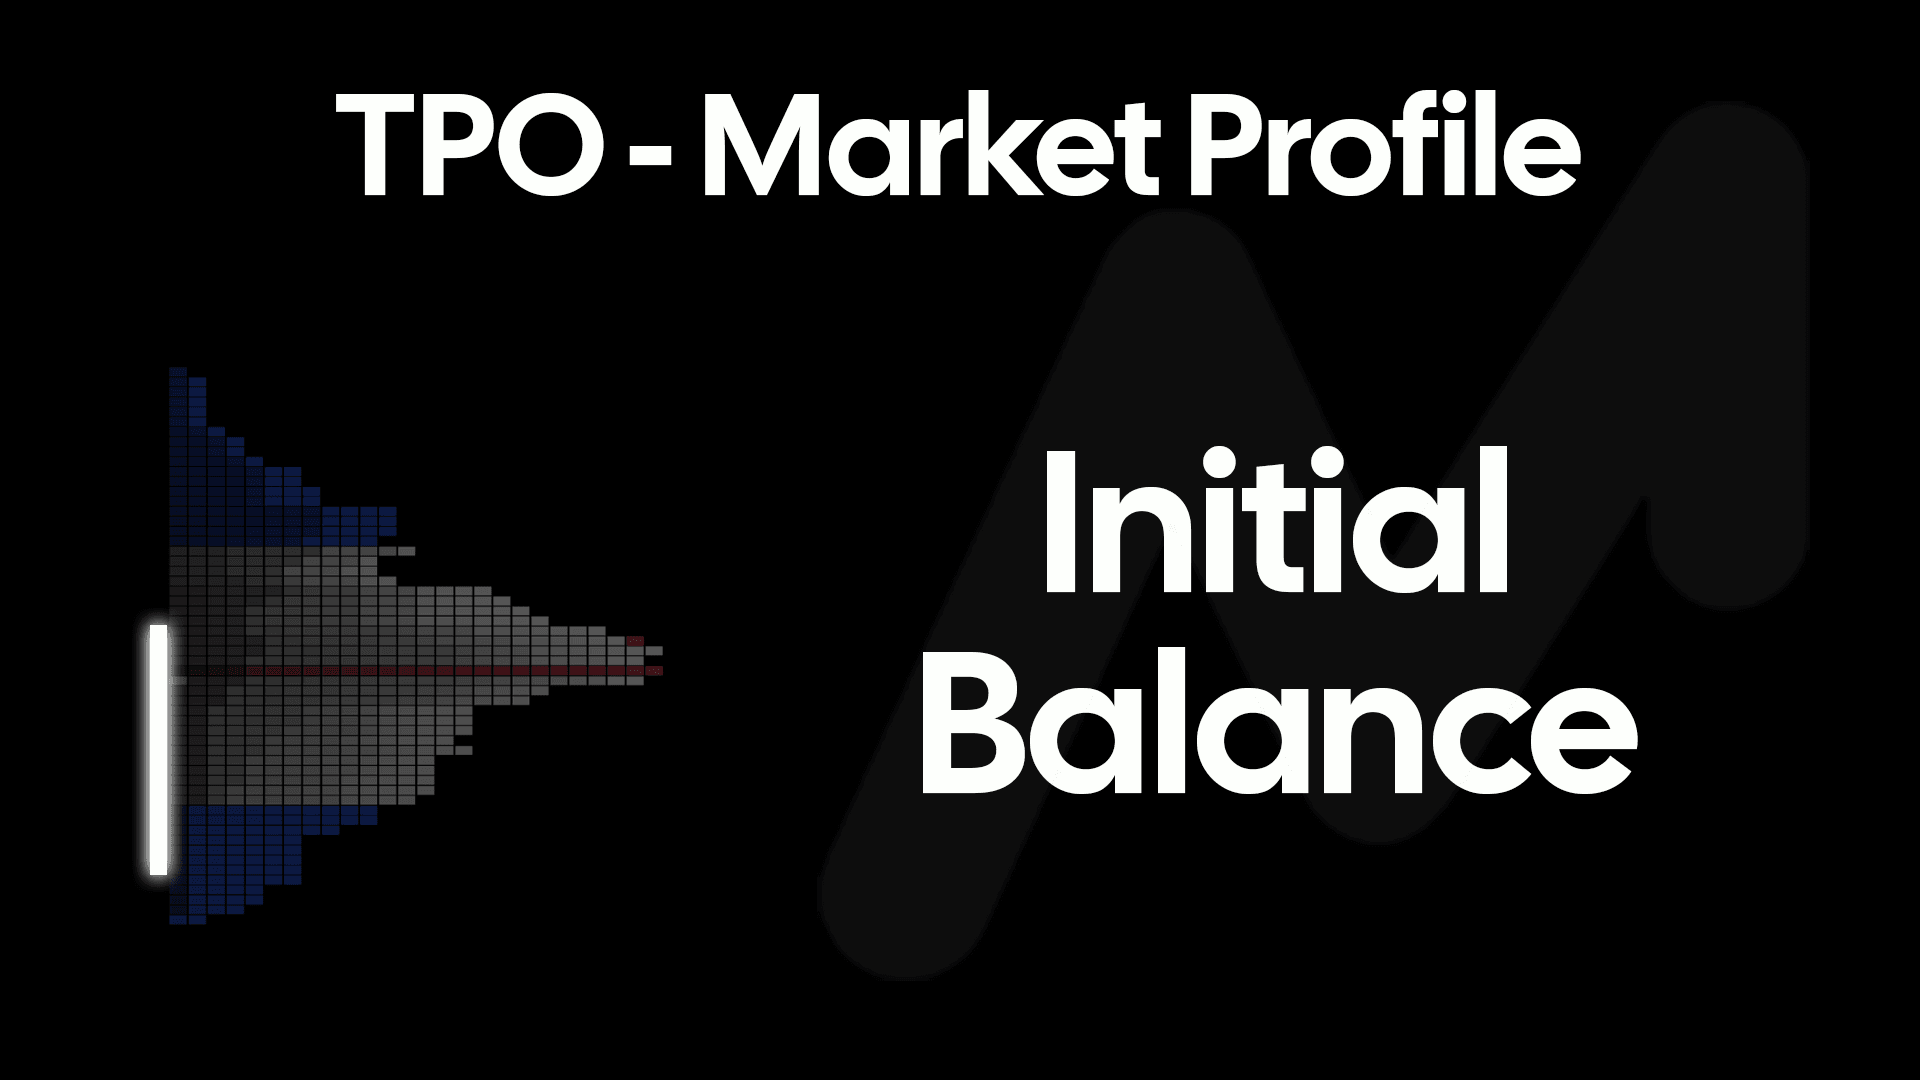
Within the context of cryptocurrency markets, this would be the period 00:00 - 01:00 UTC.
Single Prints
When price moves quickly between price levels unabated, this is an example of inefficient price action. Whilst the underlying cause of the price movement can be determined via other Order Flow tools available on Market Monkey Terminal, these examples of inefficient price action can often result in a single block being distributed within the profile.
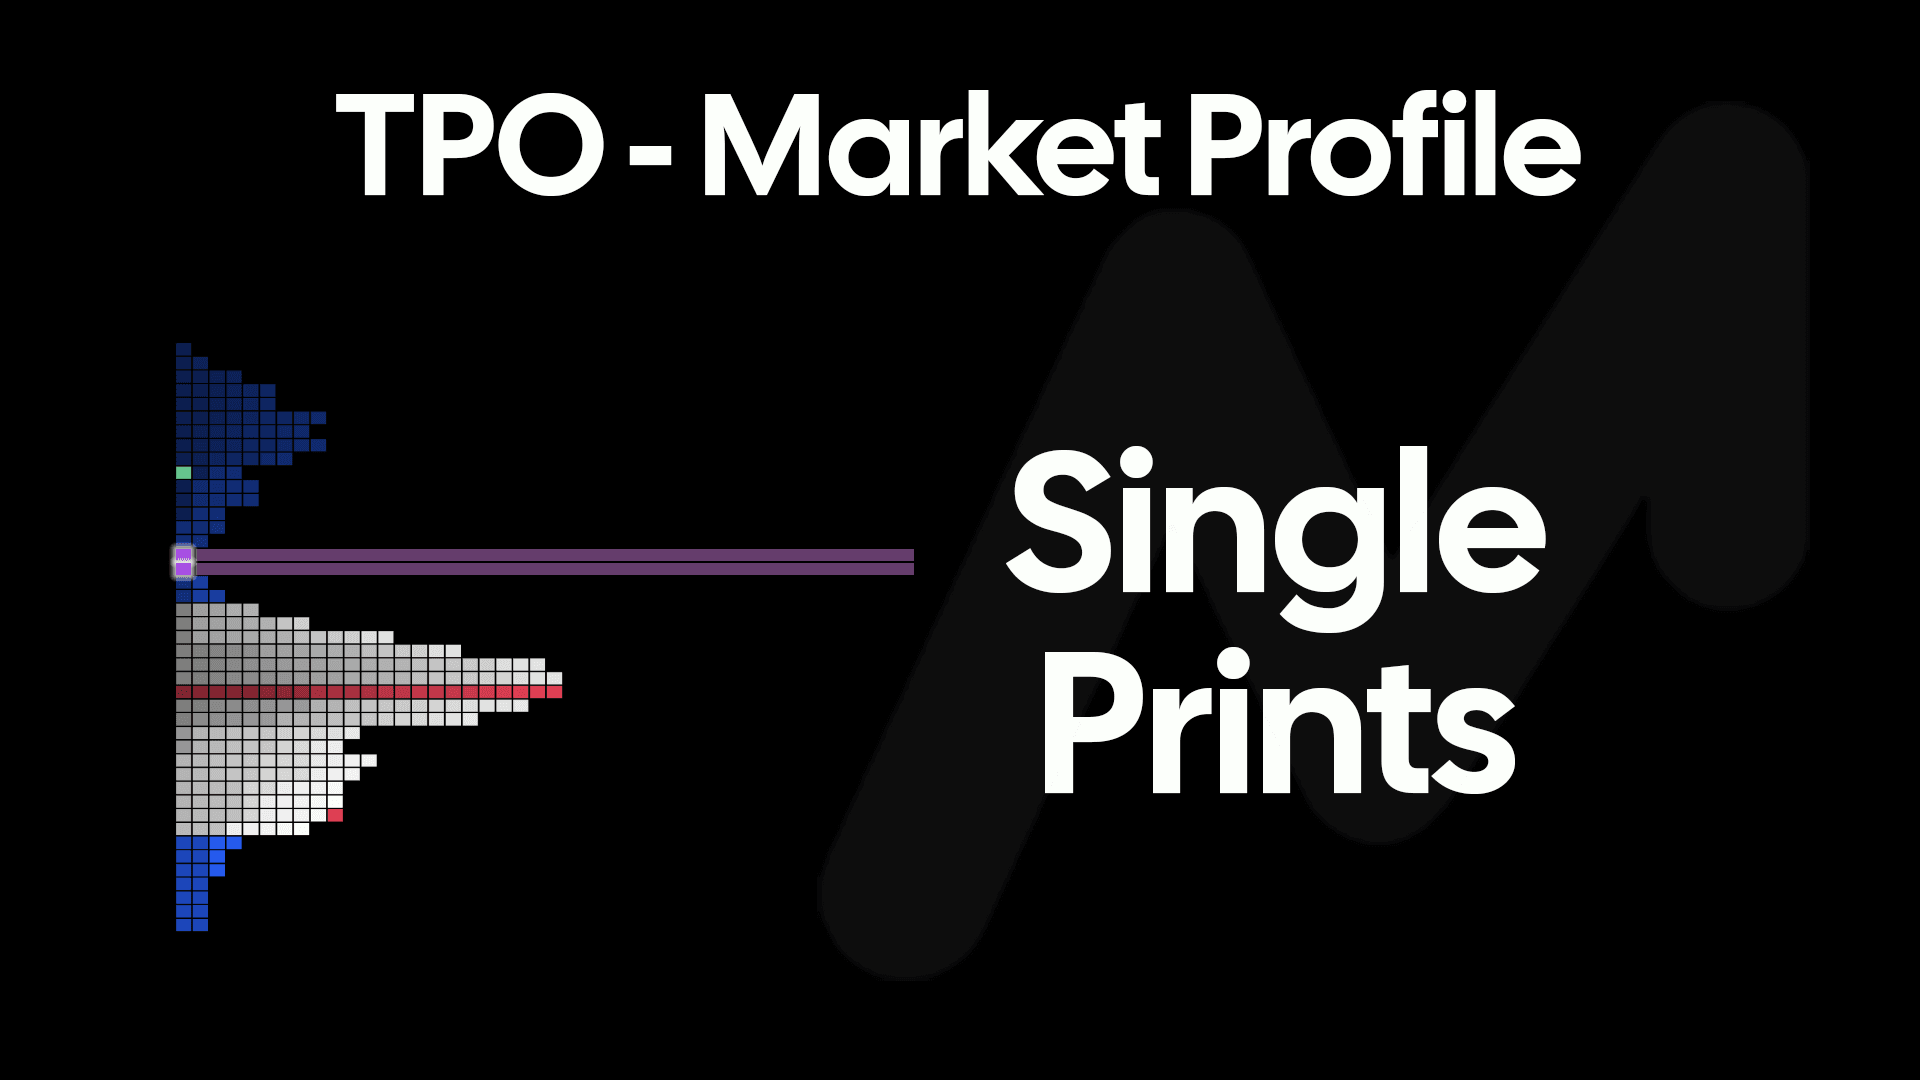
When horizontally staked, these single blocks in isolation are defined as 'Single Prints'. Due to the inefficient nature in which these 'Single Prints' occurred, the market at times will look to re-visit these particular prices in future. 'Single Prints' within the MMT TPO layer are shown in light purple color.
Poor High / Low
Poor High and Poor Lows are used to highlight the very top or very bottom of a profile in which price traded for more than one 30 minute interval. The significance of this at the very top or very bottom of a trading session is due to the auction-like nature of trading interactions.

Statistically for a 'Poor High' or 'Poor Low' to be made, price trades at the very top or very bottom price levels, for a minimum of two periods of 30 minutes. These are marked in a dark purple color within Market Monkey's TPO layer.
Merge, Split & Expand
In this section we will explain various additional functions that can be used to to merge, split and expand each TPO Profile shown with the MMT chart.
Expand TPO Profile
Previously in this article we discussed how a trading 'session' is usually defined within cryptocurrency markets as one full 24h period starting and ending at 00:00 UTC each day. Each 30 minute interval within this session has their distribution of price recorded and grouped.
To visually examine how these blocks were assigned within each of these 30m intervals, you can select to 'Expand' any of the TPO Profiles. This will remove the horizontal stacking of blocks. The 'Expanded' view of a profile reveals how TPO block was assigned to reflect each traded price level within the 30m interval.
Merge TPO Profiles
Whilst thet rading 'session' within cryptocurrency markets is uaually defined as a 24h period, alternative approaches may be best suited to to reflect different market conditions. When price is trading within a relatively tight range over multiple trading sessions, each TPO session may result in repeated or slightly varying levels. Individually, these profiles for each session within a range may be of more value if merged across the entire narrow price range to perhaps form one composite profile.
Comprising of multiple sessions merged together, the resulting composite profile can use the full range of time spend at each price level to produce a distribution that arguably better suits ranging markets. You can merge an unlimited number of rows with MMT allowing you to built you own full modularity to define your TPO profile.
Split TPO Profiles
On the opposite end of the price action spectrum, there may be a particular trading session that initially trades between one particular range of price levels, and then subsequently move sharply into a new range of price levels. This can lead to potentially arbitrary Point of Control or Value Area High / Value Area Low values.
Rather than possessing two distinct distributions within one single profile, you can choose to split any profile on MMT into separate distinct profiles. The separation of each profile into two distinct profile distributions can often be more appropriate analysis than the original two-peak distribution. 🍑