Net Longs & Net Shorts - NL & NS
Introduction
When examining flow within futures markets, one key data point that is often used to assess overall market participant activity is Open Interest. Explained in more detail on the dedicated learn article, Open Interest measures the total number of contracts that are currently held within open positions. An increase in Open Interest indicates an increase in the number of contracts held within open positions - both long and short - by market participants. A decrease in Open Interest indicates a decrease in the number of contracts held within open positions - both long and short. Crucially, whilst we can conclude from OI that positions are either being added-to or opened, or conversely, positions being cut or closed, there is no distinction or allocation to determine Net Long or Net Short positioning.
Whilst OI of itself is not enough to determine Net Long or Net Short positioning, when combining changes in OI with other data sources derived from price, volume, reasoned assumptions and probabilities regarding Net Long & Net Short positioning, can potentially be formed. If changes with OI were published with each trade, combining other trade information and volume data, it would be a formality to determine true Net Long and Net Short positioning. Given the vulnerability and susceptibility to market manipulation if this were to be the case, exchanges will choose - entirely their own discretion - the frequency in which changes OI are published. Ultimately this frequency of published OI updates by the exchange, determines the accuracy of probabilities used within Net Long & Net Short position estimations.
Despite these varying limitations across exchanges, MMT has attempted to construct it's own proprietary Net Long and Net Short positioning indicators. A weighted distribution is applied to streams of market data that attempt to allocate and attribute changes in OI, to subsequent changes in Net Long & Net Short positioning. Please note the resulting values from these Net Long & Net Short indicators are purely mathematical estimations that are untested and unverified. They should not be used to form any trading decisions or hypothesis.
Net Long / Net Short Elements
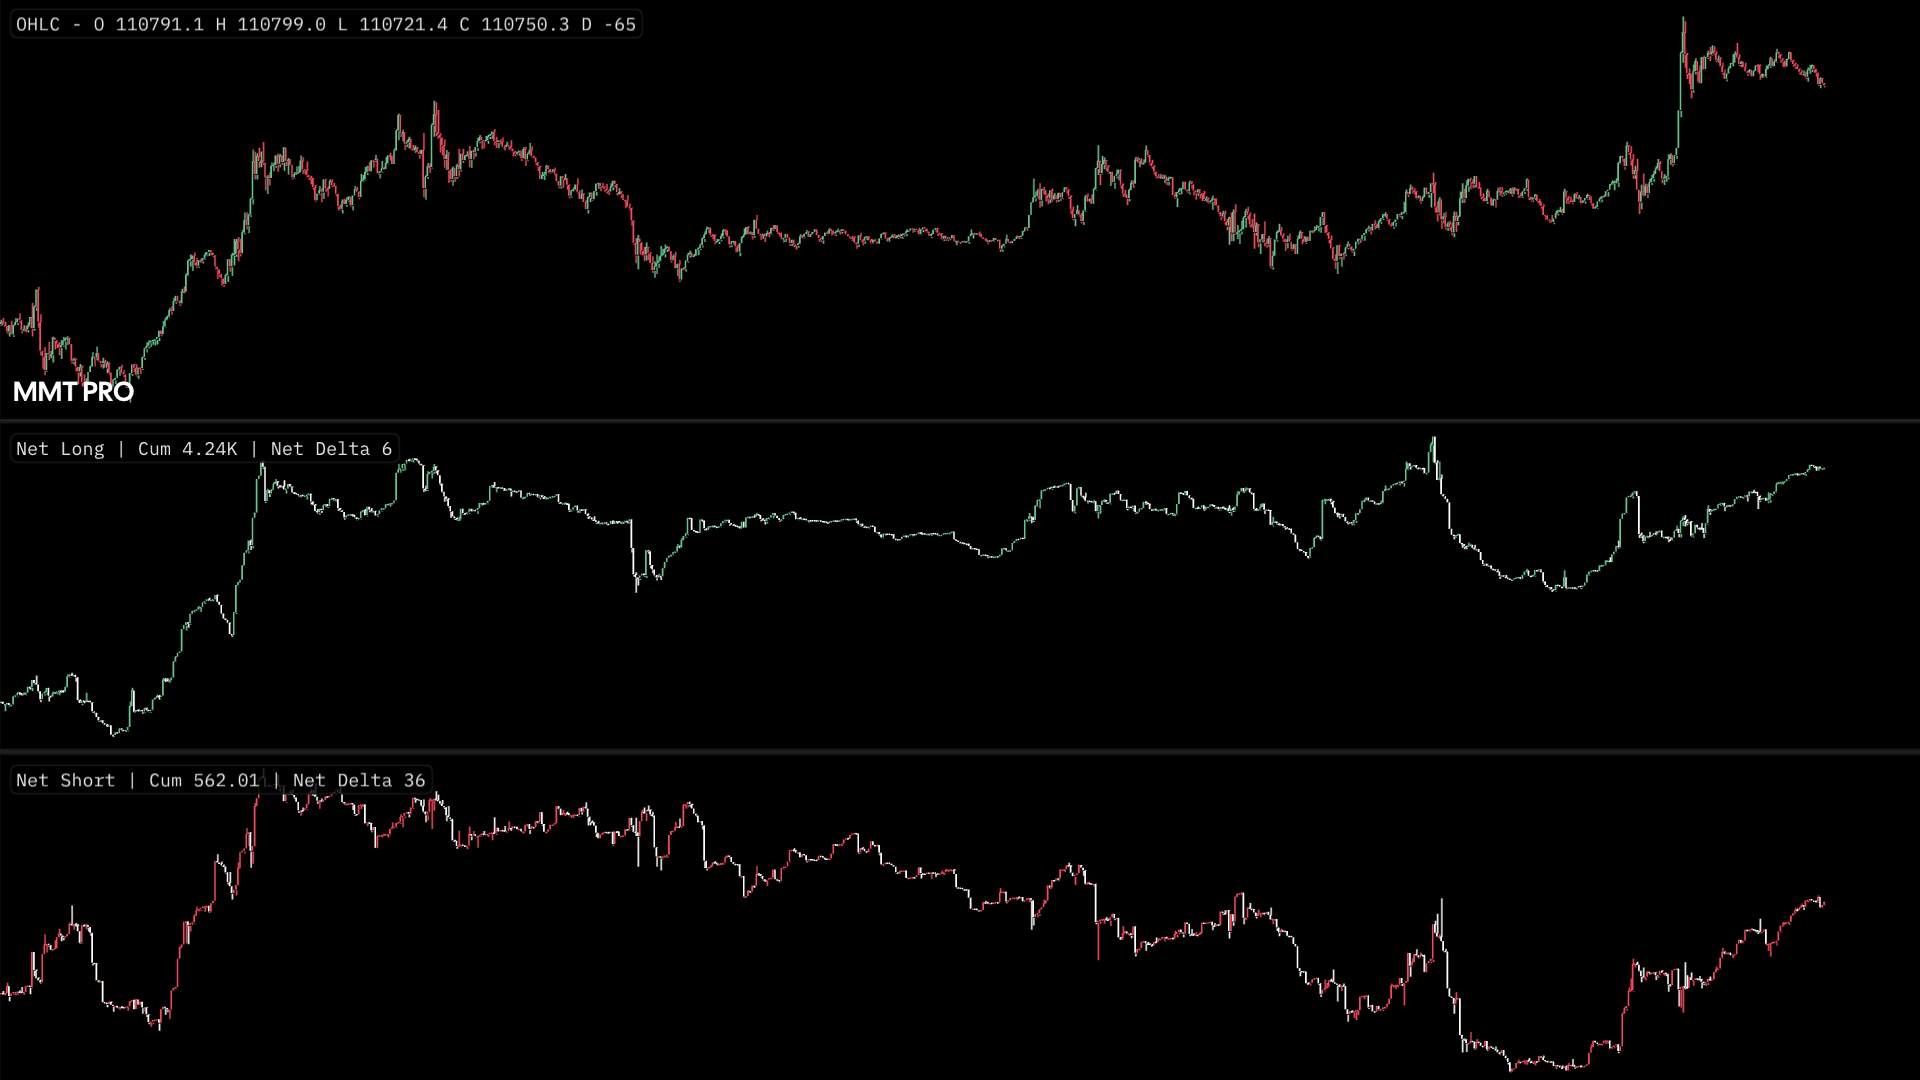
Both the Net Long & Net Short indicators are rendered as candlestick charts underneath your main price chart. As underlying market data points such as Open Interest, price and volume are updated, calculations attempt to assess and attribute the net change in Open Interest between Net Long and Net Short positioning. This distribution of net changes to Net Long and Net Short positioning will always total the net change in OI for the same candle rotation.
Net Longs
An estimated increase in cumulative Net Longs will be shown by default as a lime candle on your chart, with the resulting closing Net Long value having increased from its opening value.
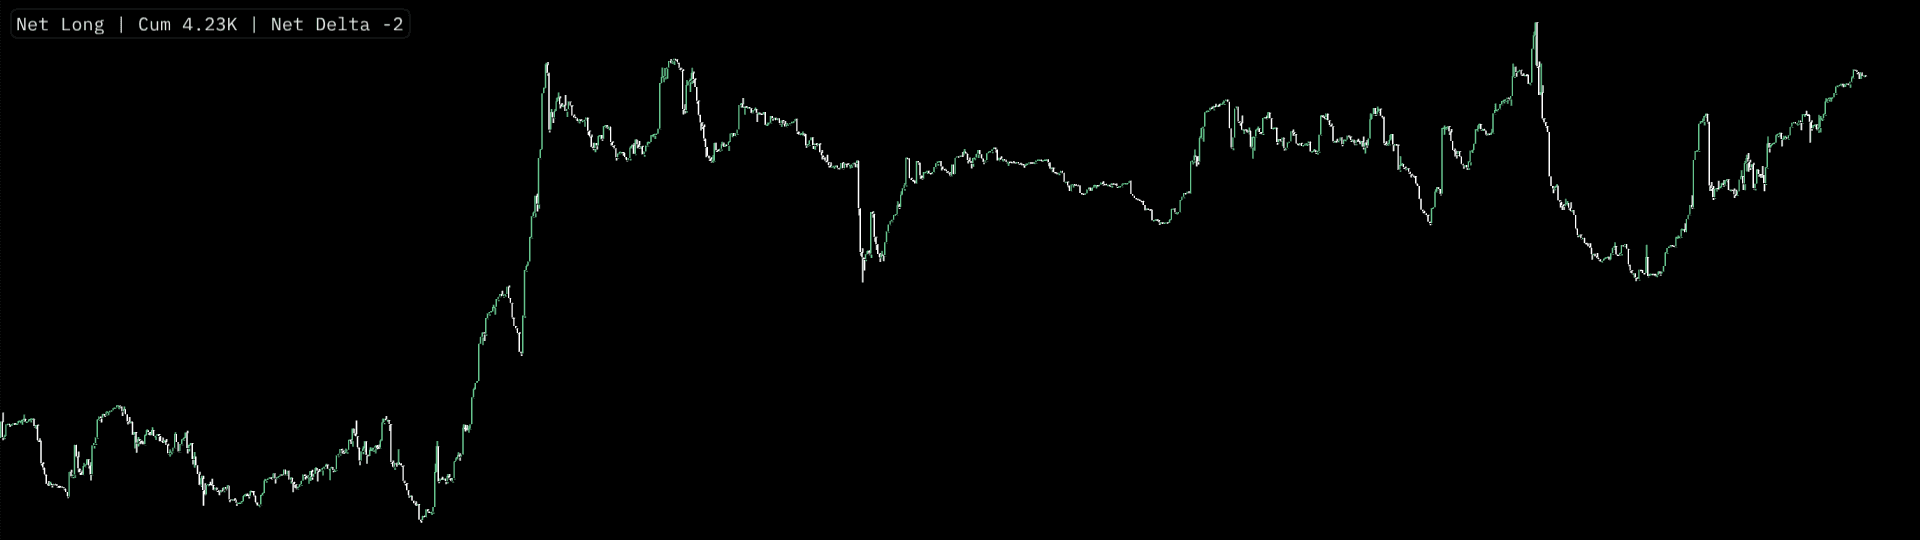
This would indicate that there has been an estimated increase in long poitions with either new long positions being opened, or existing long positions being added-to / increased. An estimated decrease in long positions would be shown by default as a gray candlestick with long positions being either closed entirely or cut in size.
Net Shorts
An estimated increase in cumulative Net Shorts will be shown by default as a Red candle on your chart, with the resulting closing Net Short value having increased from its opening value.
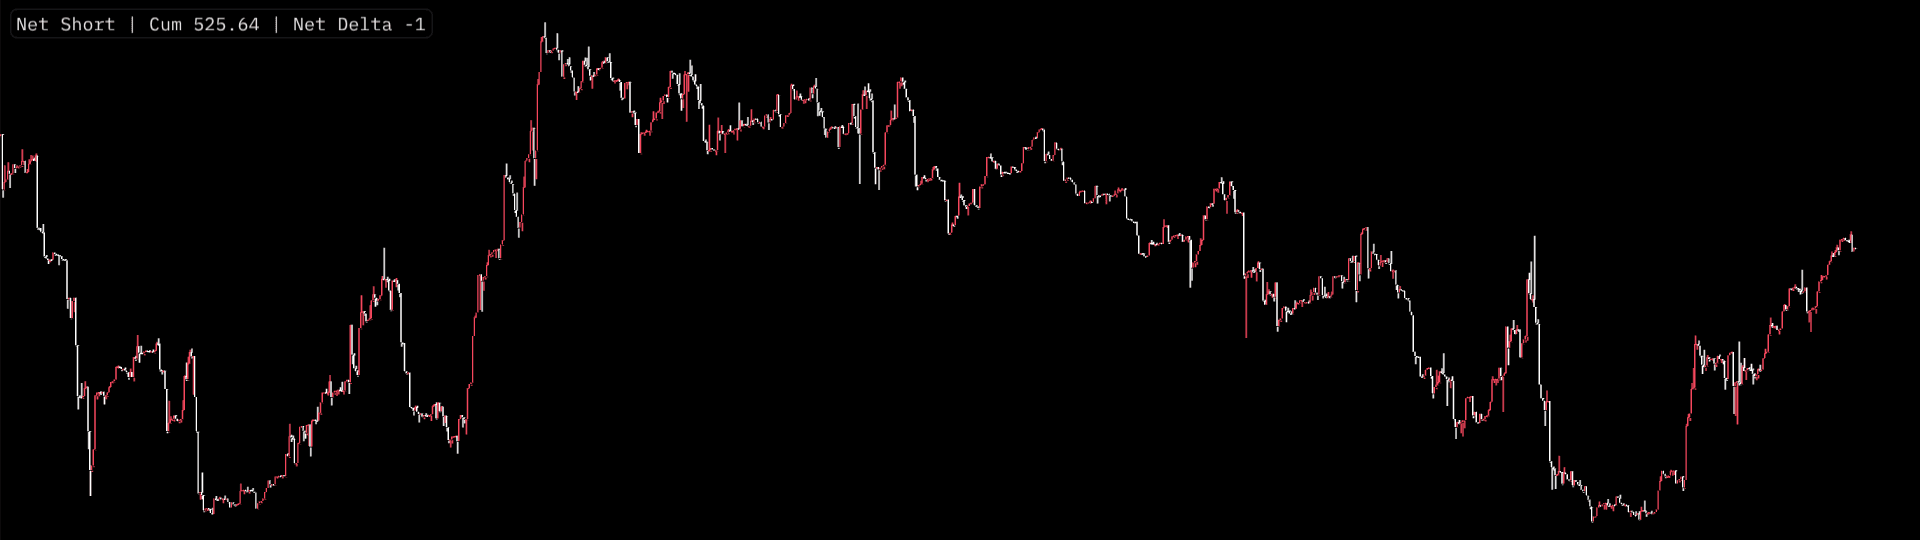
This would indicate that there has been an estimated increase in short poitions with either new short positions being opened, or existing short positions being added-to / increased. An estimated decrease in short positions would be shown by default as a gray candlestick with short positions being either closed entirely or cut in size.
Depending upon your configured settings for each respective Net Long & Net Short indicator, increases in in the net value of either will be shown above their respective colored candles, with decreases shown beneath their respective gray candles.
Net Long / Net Short Configurations
There are a number of configuration options available for the Net Long & Net Short indicators.
Appearance
Net Long & Net Short indicator data is rendered a candlestick chart. There are color poickers available for each element within the candlestick plot, including; Body, Wick, Border. To visually distinguish between other candlestick layers such as CVD or Open Interest, each indicator has its own color scheme. By default;
- Net Longs - Uses a lime color for an increase in possible net long positioning.
- Net Shorts - Uses a red color for an increase in possible net short positioning.
- A net decrease in either the Net Long or Net Short indictor will be shown in Gray.
Misc
Show Net Values
This toggle will display the raw net value change in Net Long or Net Short between candles.
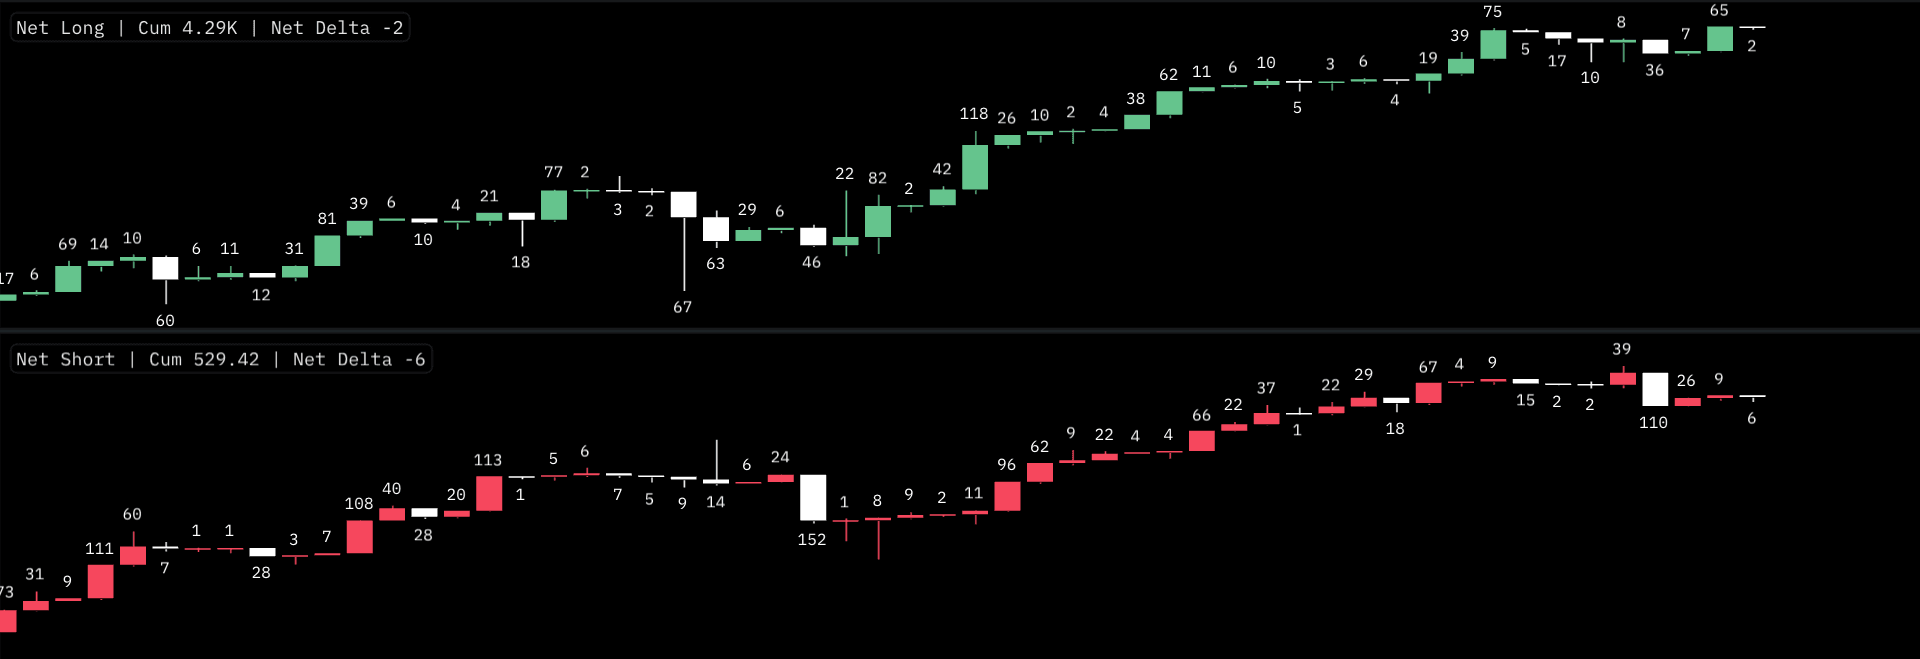
If a net increase was determined, the value will be displayed above its respective candle.
If a net decrease was determined, the value will be displayed below its respective candle.
MMT Quadratic Smoothing
The underlying calculations for MMT's Net Long & Net Short indicators are proprietary. In short, a range of market data streams are assessed against one another, and subsequently weighted against changes in Open Interest. Whilst the weighting for these calculations have been constructed adapt in real-time to adjust to changes in volatility within the trading environment, an input is provided to smooth these weightings. A smaller the value that is set for the Quadratic Smoothing input, the distribution of these weighting will will result in more 'extreme' swings the respective Net Long or Net Short output's. Whereas setting the Quadratic Smoothing input to 1 , will evenly distribute the underlying weightings, resulting in a 'smoothening' effect to the respective Net Long or Net Short output's.