Open Interest
Introduction
For those trading derivative markets, Open Interest is often a core data point to analyze. Representing the total number of active, unsettled derivative contracts held by market participants at a given time, It is the sum of all long and short positions currently held by traders.
Rising OI suggests new money entering the market or, existing held positions being enlarged. Falling OI suggests positions are being closed or, existing held positions being reduced. Regardless of either a rise or decline, the printed read of Open Interest is direction agnostic, with net changes both long and short positions, combined together.
Whilst Open Interest is not indicative of price in of itself, it can quantify market participants' commitment and sentiment to the given price action.
Notes on Open Interest
There are a few aspects traders should be aware of when examining Open Interest data. Below is a non-exhaustive list to consider when using OI analysis as confluence to a trading decision.
Not Applicable in Spot Markets
In spot markets, settlement of trades and exchange of assets are immediate. Once executed, there is no further commitment or future obligations required by either party that participated within the trade. Derivative contracts on the other hand create a number of ongoing obligations until the market participant closes or 'exits' their position. Given the use of leverage when trading such contracts, Open Interest is a unique measure for leverage and positioning as a whole.
Published Update Frequency
When combined with other metrics, Open Interest can be an extremely value data point for assessing derivative markets. However, the value that can be derived from it, is highly tied to the frequency in which exchanges publish net changes in OI. Generally speaking, the higher the frequency in which these changes are published, the higher the value that can be extracted from such data.

This update frequency can vary wildly between exchanges. Bybit and Bitmex for example publish between 10-15 OI updates per minute, whereas Binance and OKX may only report between 4-6 updates per minute. Paradoxically, even when examining a single perpetual market from one exchange in isolation, the intervals in which Open Interest changes are reported can also vary, particularly during volatile market conditions.
Aggregated Open Interest
The Open Interest layer ordinarily derives its values from the trading pair currently displayed on your chart. MMT further facilitates the aggregation of data from diverse pairs across various trading platforms, thereby offering a more comprehensive and refined perspective on trading activity.
Within the Open Interest layer settings, provided is the 'Aggregate' section, enabling the selective activation or deactivation of individual inputs for inclusion or exclusion in the aggregated calculation.
As you toggle each exchange, the Open Interest layer automatically re-calculates and re-renders, to reflect your selected inputs.
Activating Open Interest
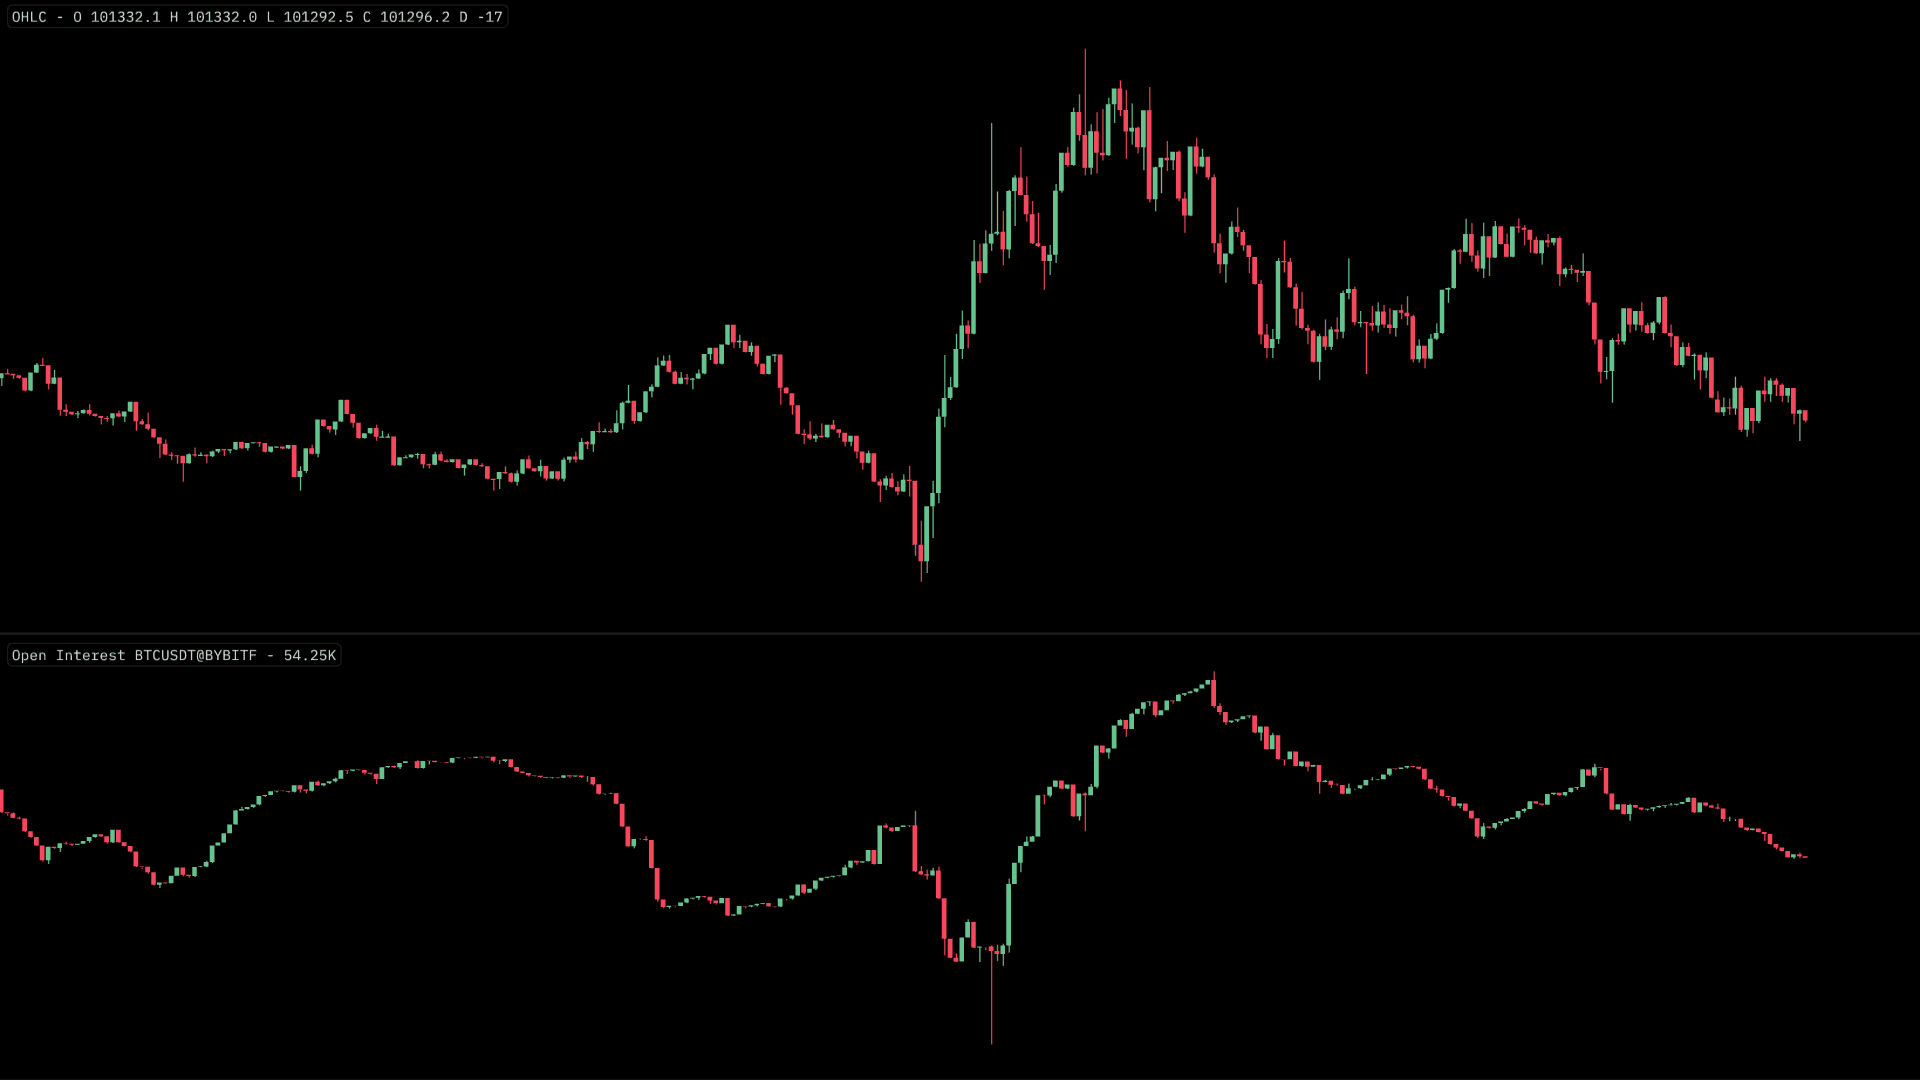
To activate the Open Interest layer, head over to the 'Indicators' and then select 'Open Interest'. This will render as an underlay to your selected chart and market.
Displayed as an OHLC in candlestick form, MMT samples OI data rapidly, so intra-candle reporting, often resulting in wicks, can provide additional insight.
Open Interest Configuration & Settings
At present, the primary configuration options are simply the colors used within the candlestick render of Open Interest.
'Bull' Color
This will determine the color used to signify when the OI closes its print and it is greater than the opening OI print.
'Bear' Color
Conversely the 'Bear Color' would be used when the OI closes its print and it is less than than the opening OI print.