Chart Widget
Introduction
Displaying a range of both historical and real-time data feeds, the Chart Widget is often the main element of the Market Monkey Terminal.
Chart Elements
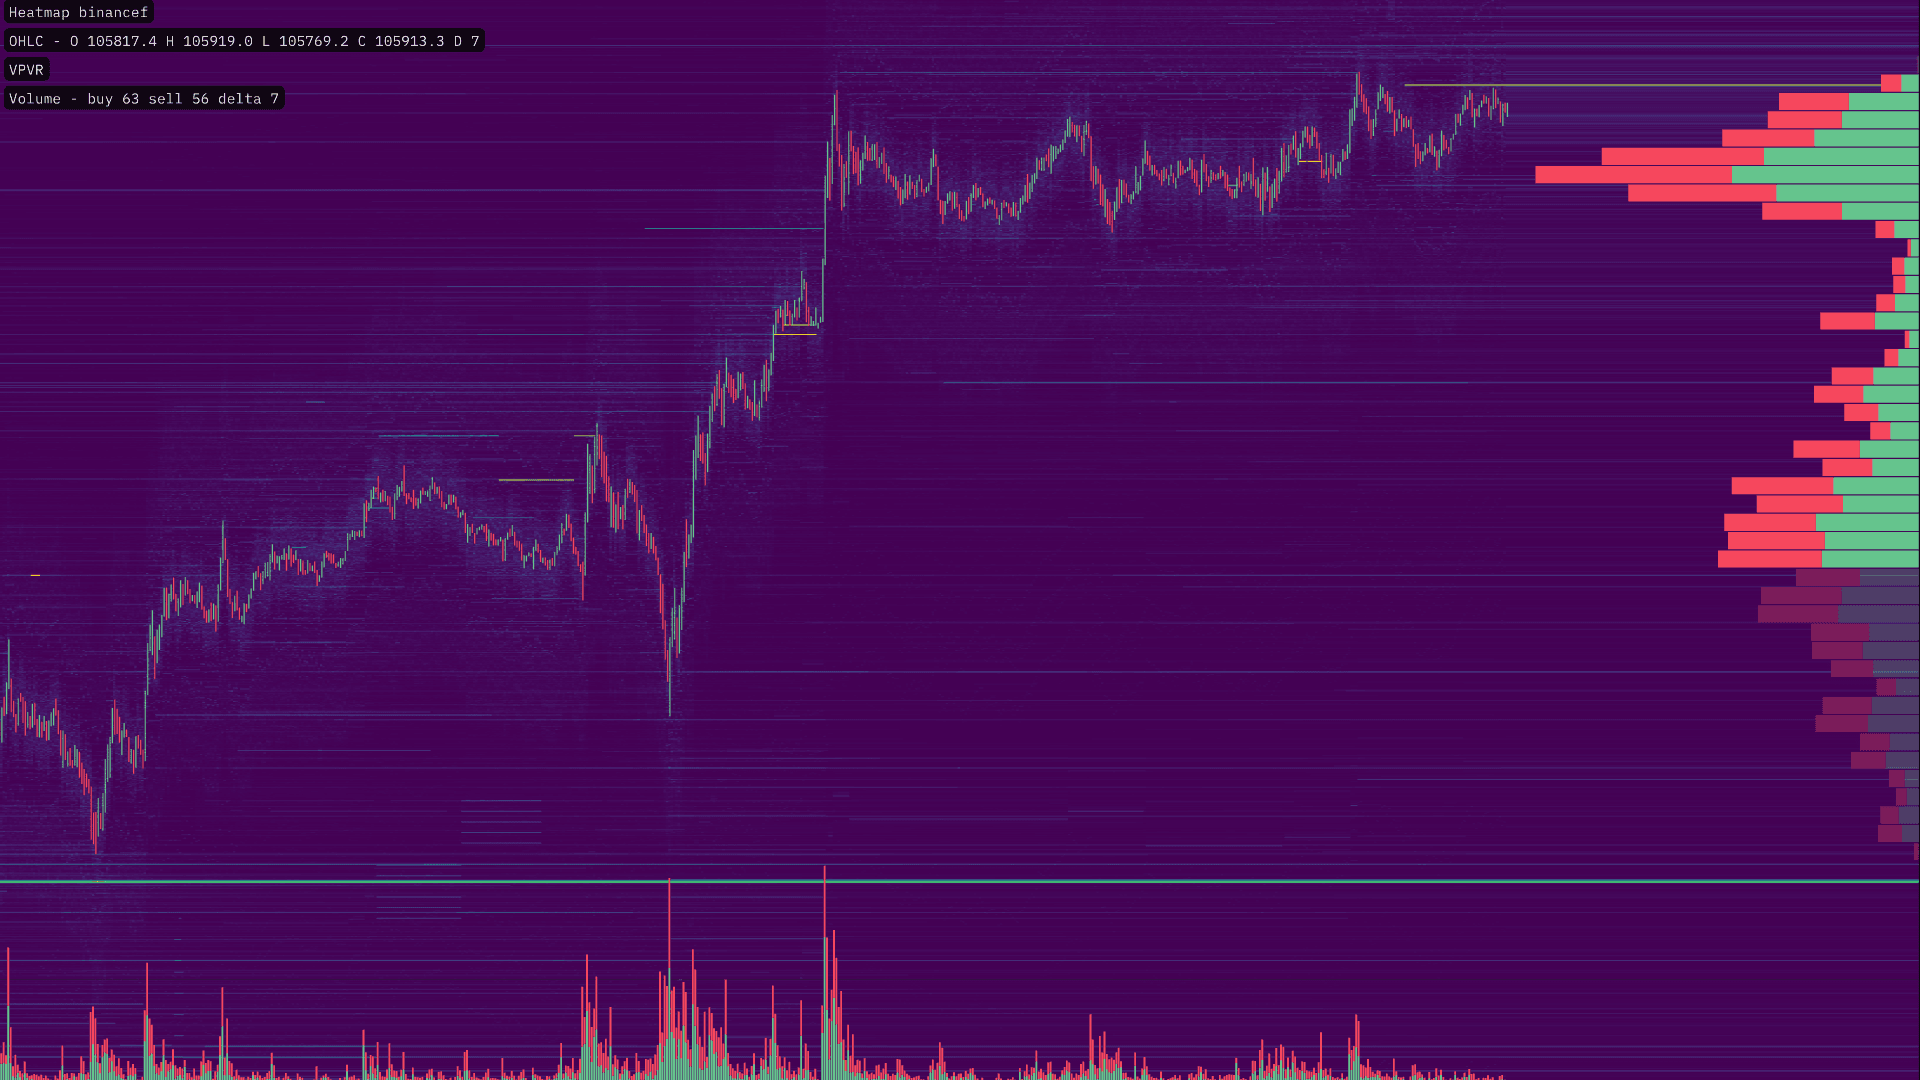
By default the chart will render the following layers / indicators on your chart:
- Heatmap - Liquidity Heatmap
- Price - OHLC Candlestick
- VPVR - Volume Profile Visible Range
- Volume - Market Buy & Market Sell Volume
There are quite a few methods to plot Price, along with an infinite combination of layers & indicators to add and configure to your chart. Below we will go through an overview of what is available on MMT. Each layer or tool will have a link for further reading.
Order Flow
The Market Monkey Terminal provides a wide range of professional-grade Order Flow tools for your chart. We will go over a few of the core ones here.
Footprint Charts - Incorporate market volume, delta or total volume activity alongside a candlestick. VPVR - Volume Profile Visible Range - Monitors market buy and market sell volume and flow at each price, within the area in view on your chart. VPSV - Volume Profile Session Volume - Similar to VPVR, the VPSV layer tracks this market volume over the set period of time. Volume Bubbles - View abnormally high volume in the form of deltas or total volume displayed as a bubble over your price chart.
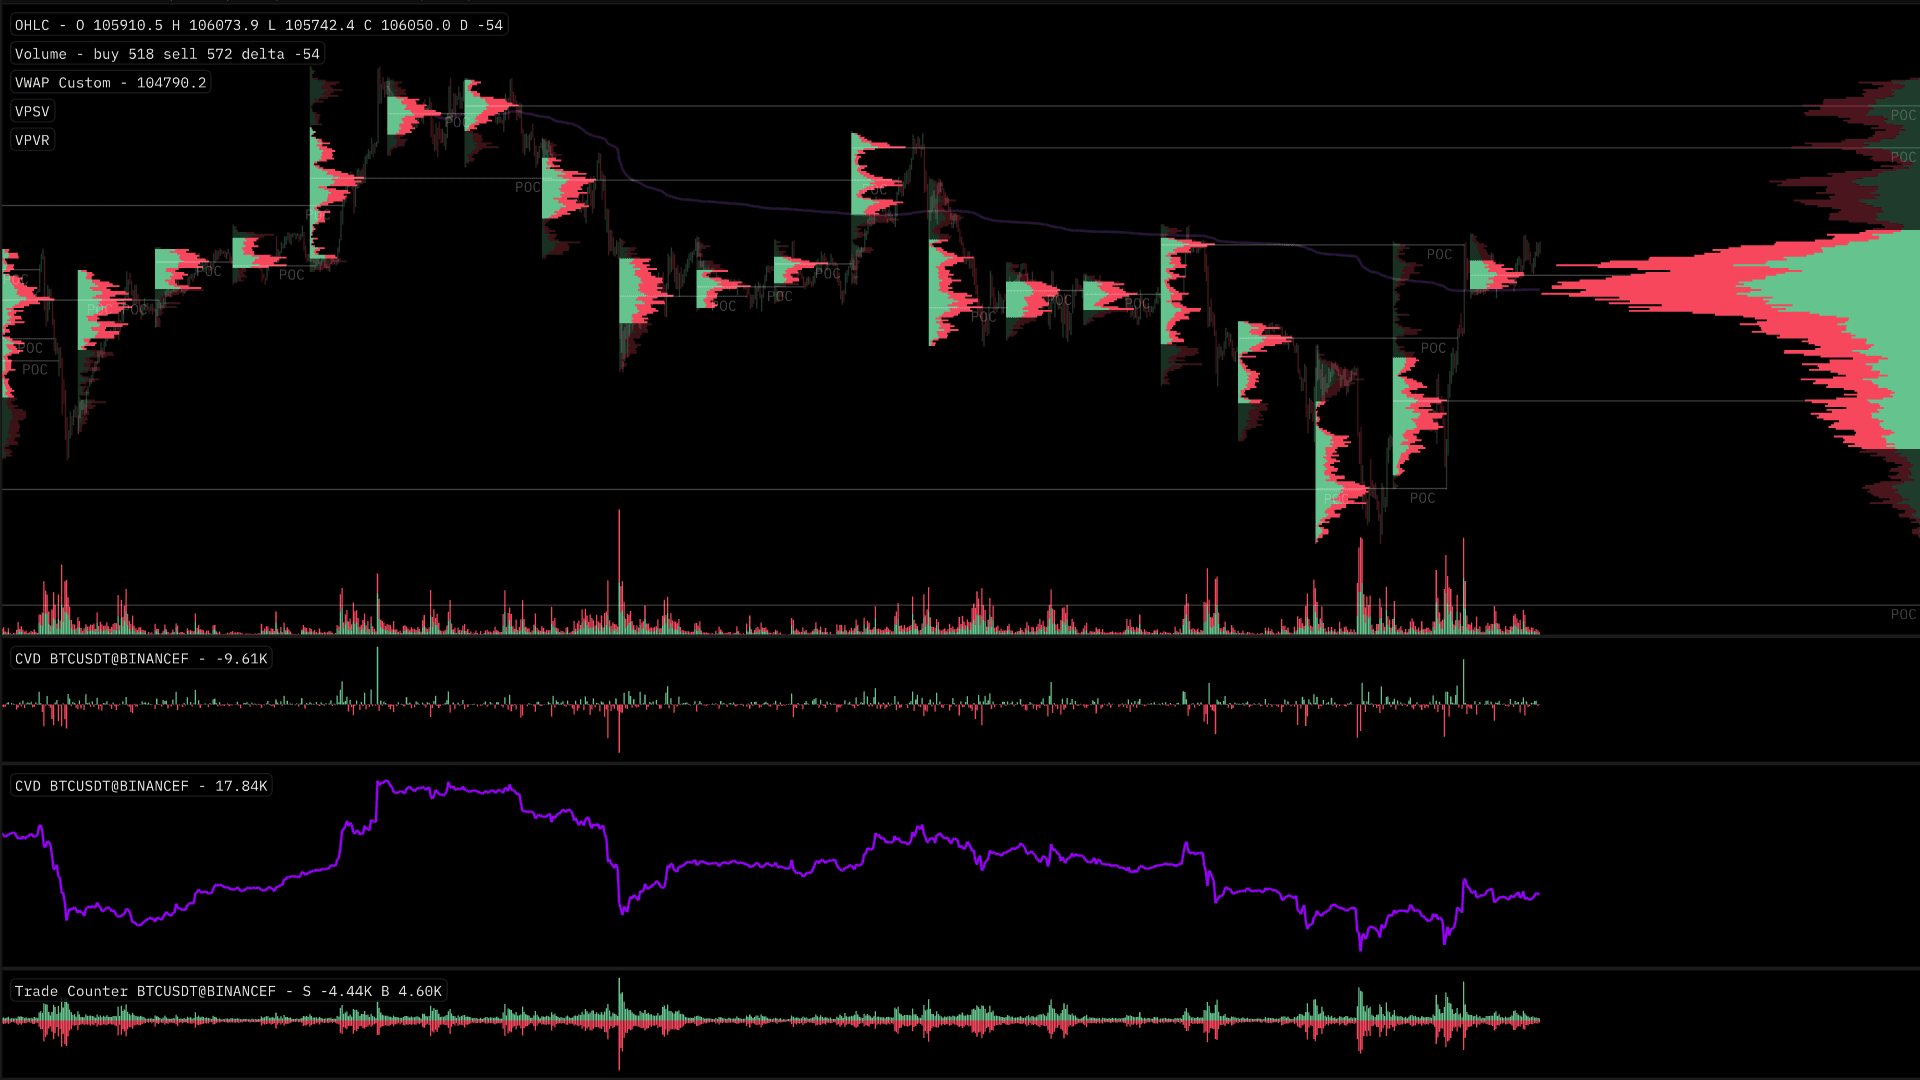
VWAP - Volume Weighted Average price - Over a specified period, the average price that is weighted by the total volume traded on each new candle. CVD - Cumulative Volume Delta - Spot absorption and exhaustion divergences of price and market participant with the CVD layer. Trade Counter - Total numerical counts of market buy orders and market sell orders. Volume - Market Buy Volume & Market Sell Volume
Explore these tools in more detail in each of their respective learn pages.
Liquidity Analysis
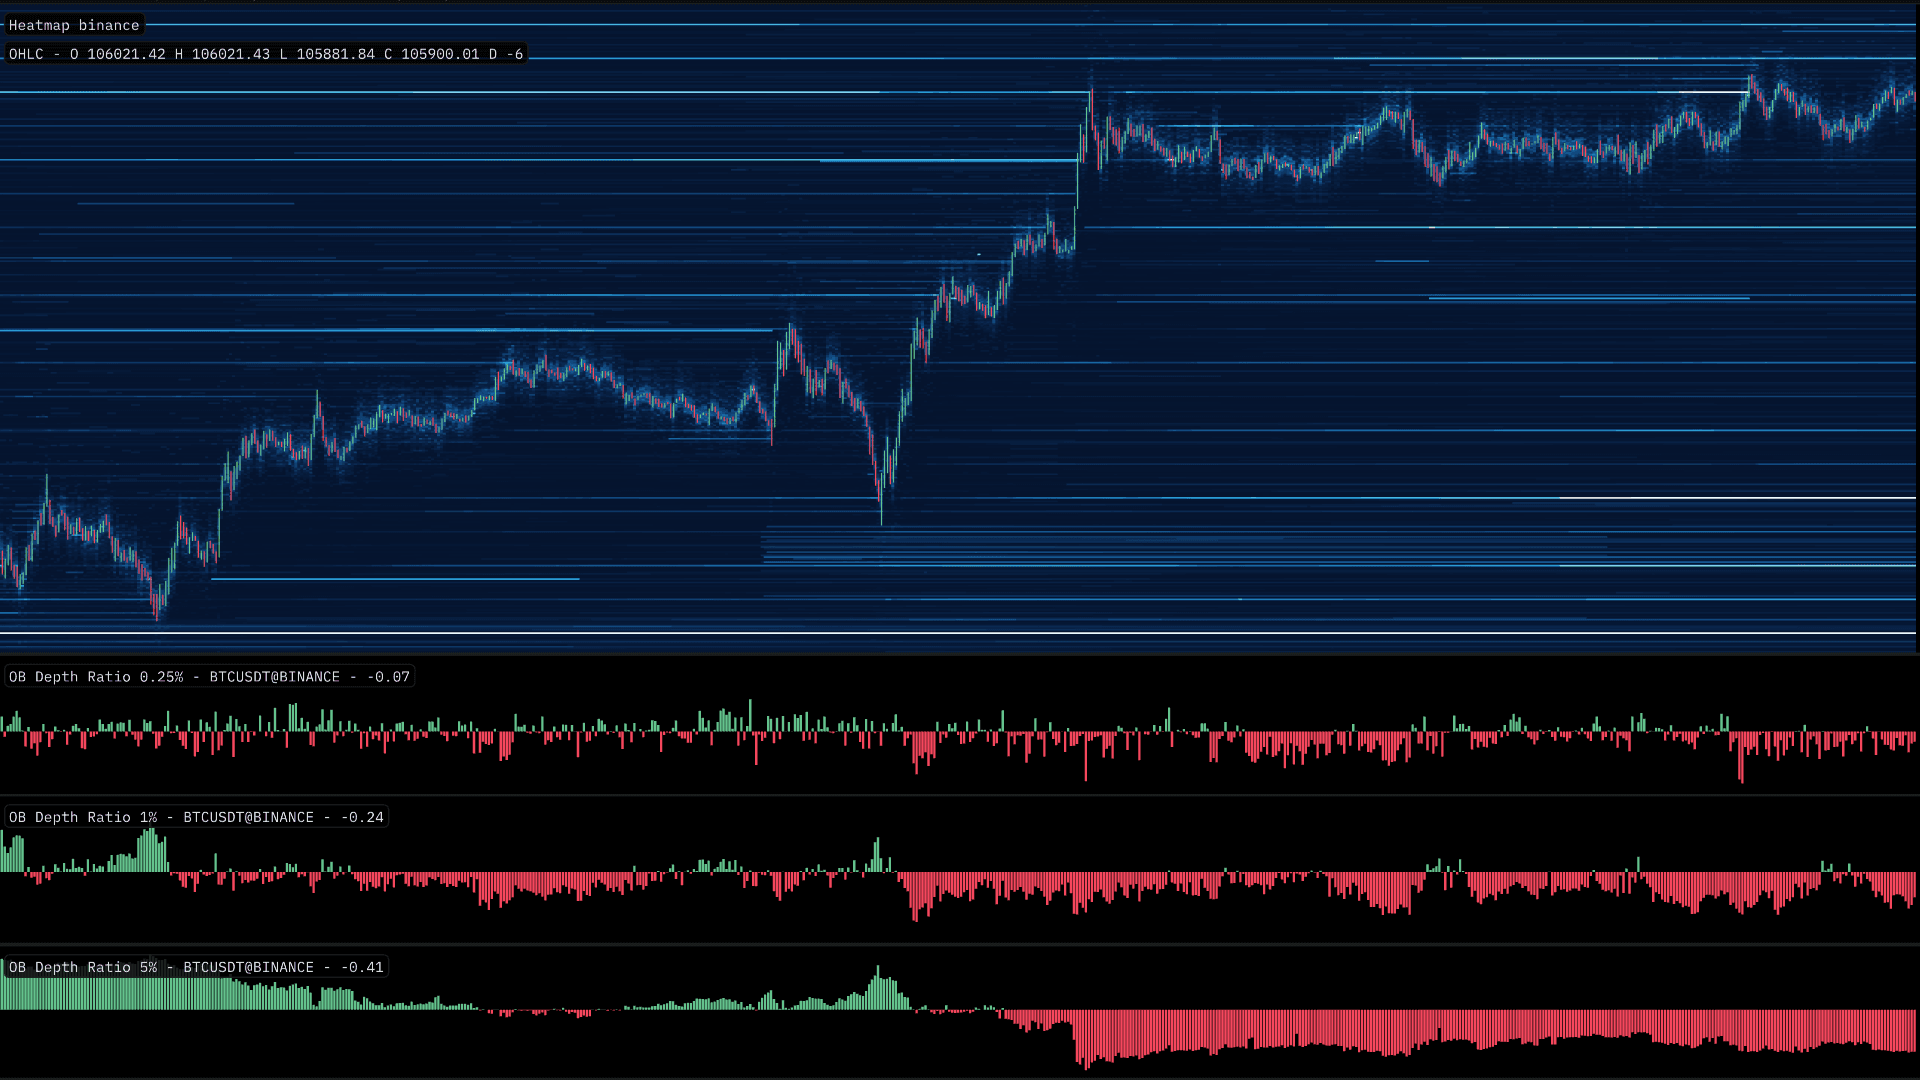
There are a range of tools to assess dynamics with the Order Book on MMT. Some are in the form of widgets, whilst others like the Heatmap and Order Book Imbalance are rendered directly on your chart.
Heatmap
View the Order Book history directly on your chart via MMT's Heatmap. Aggregate across exchanges on the fly to gain broader market view of liquidity.
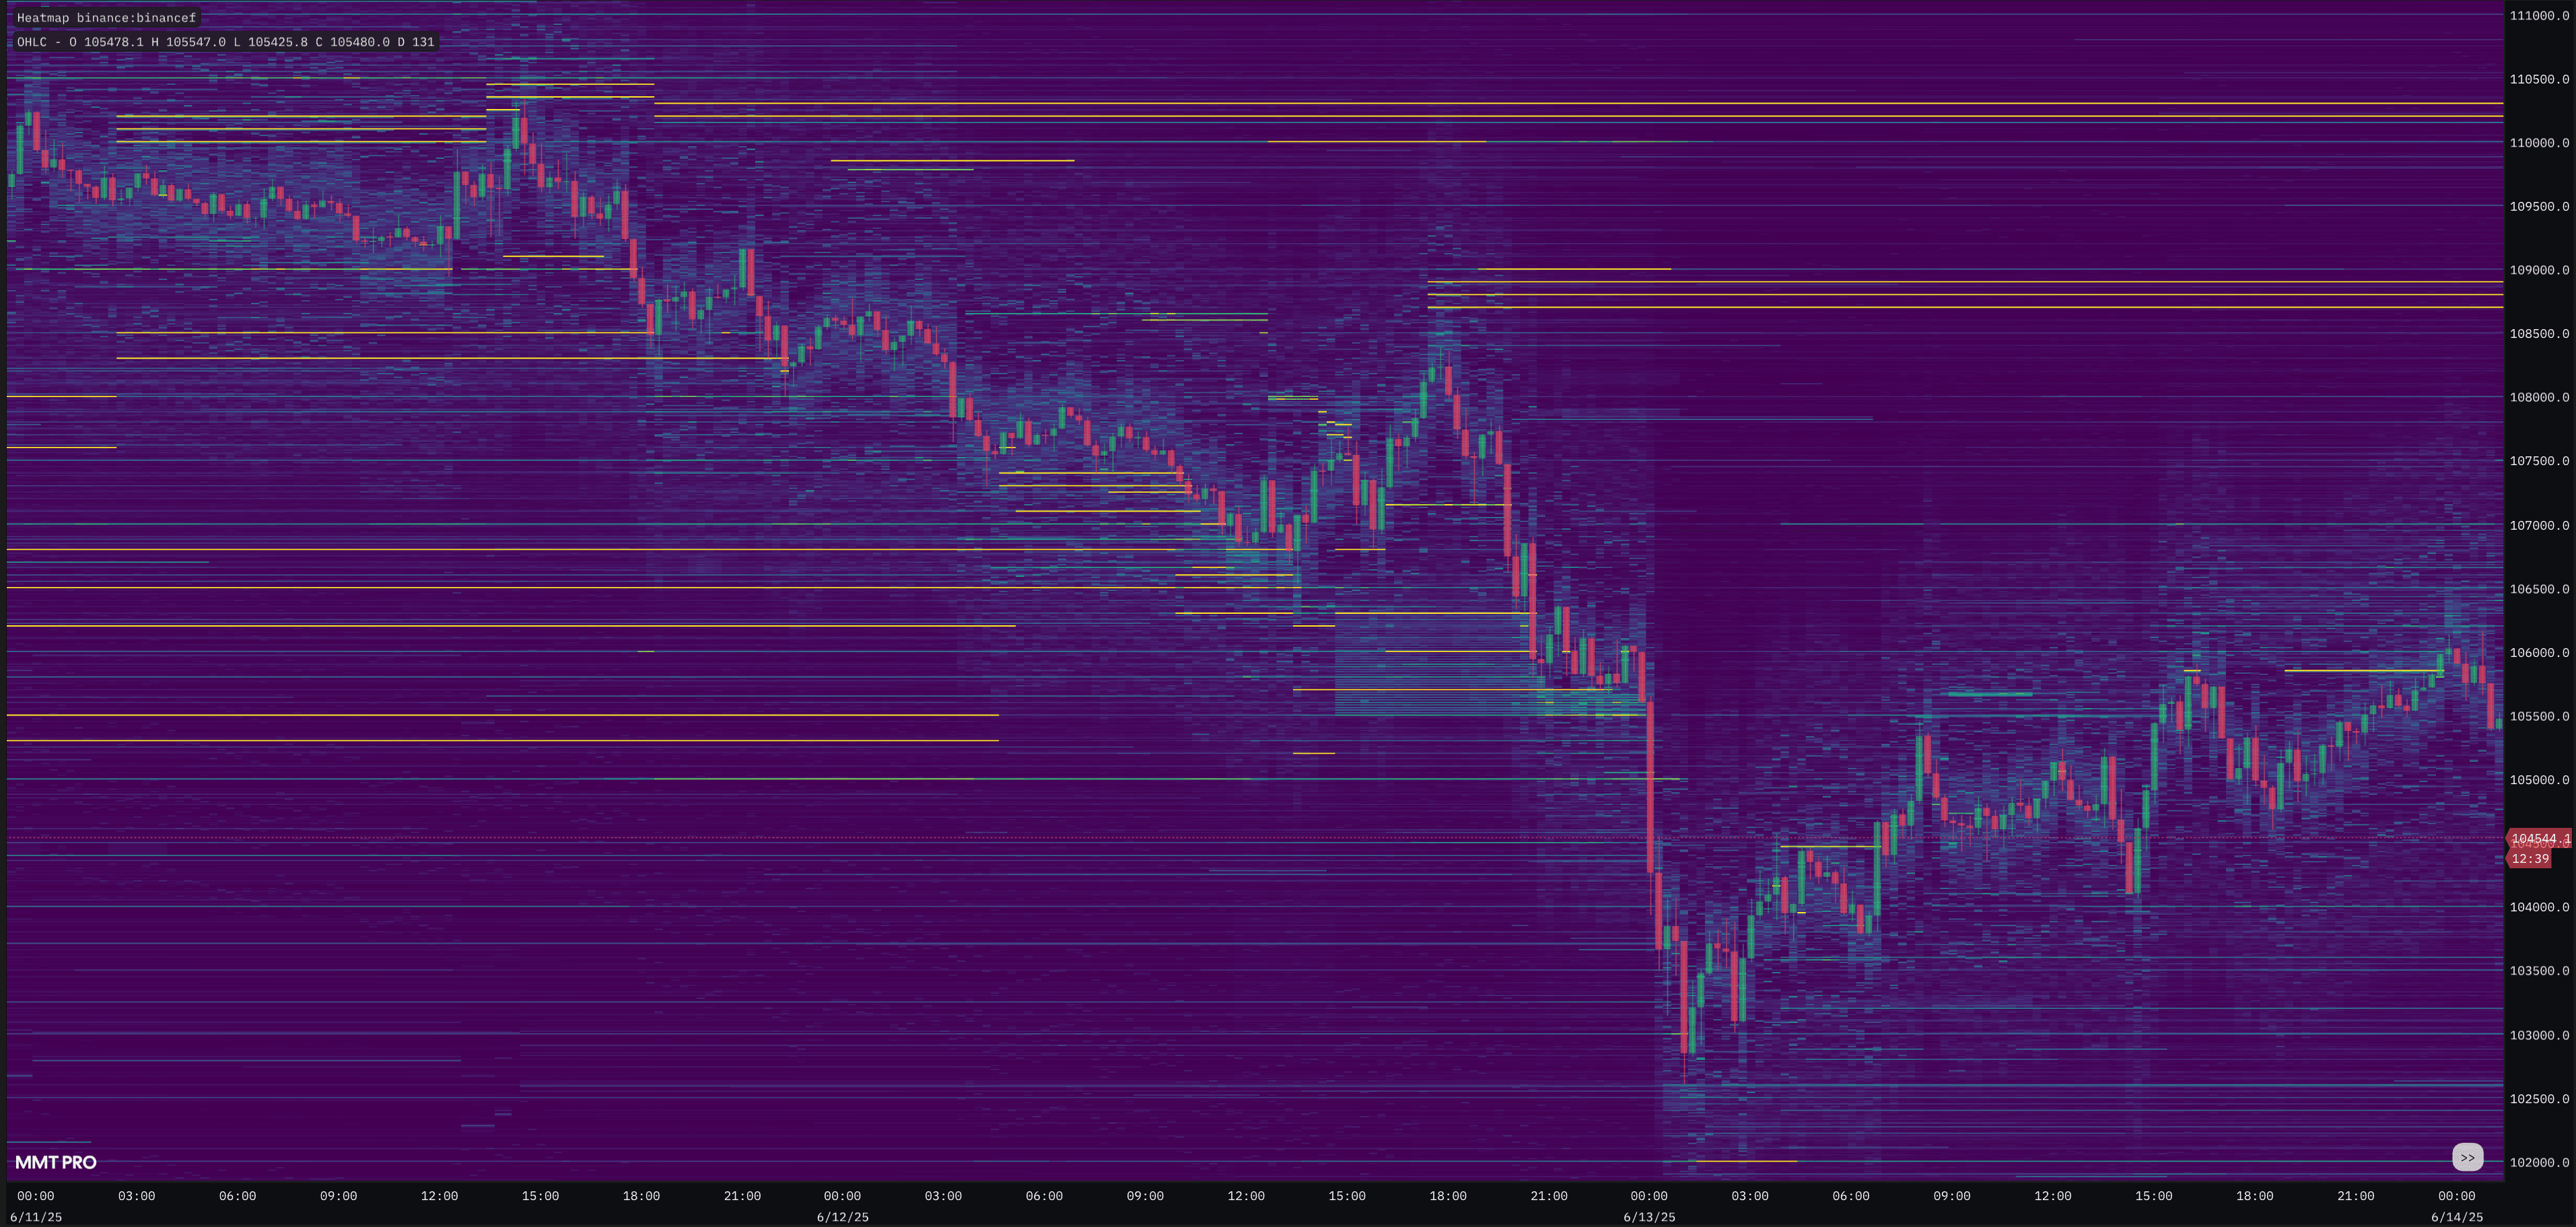
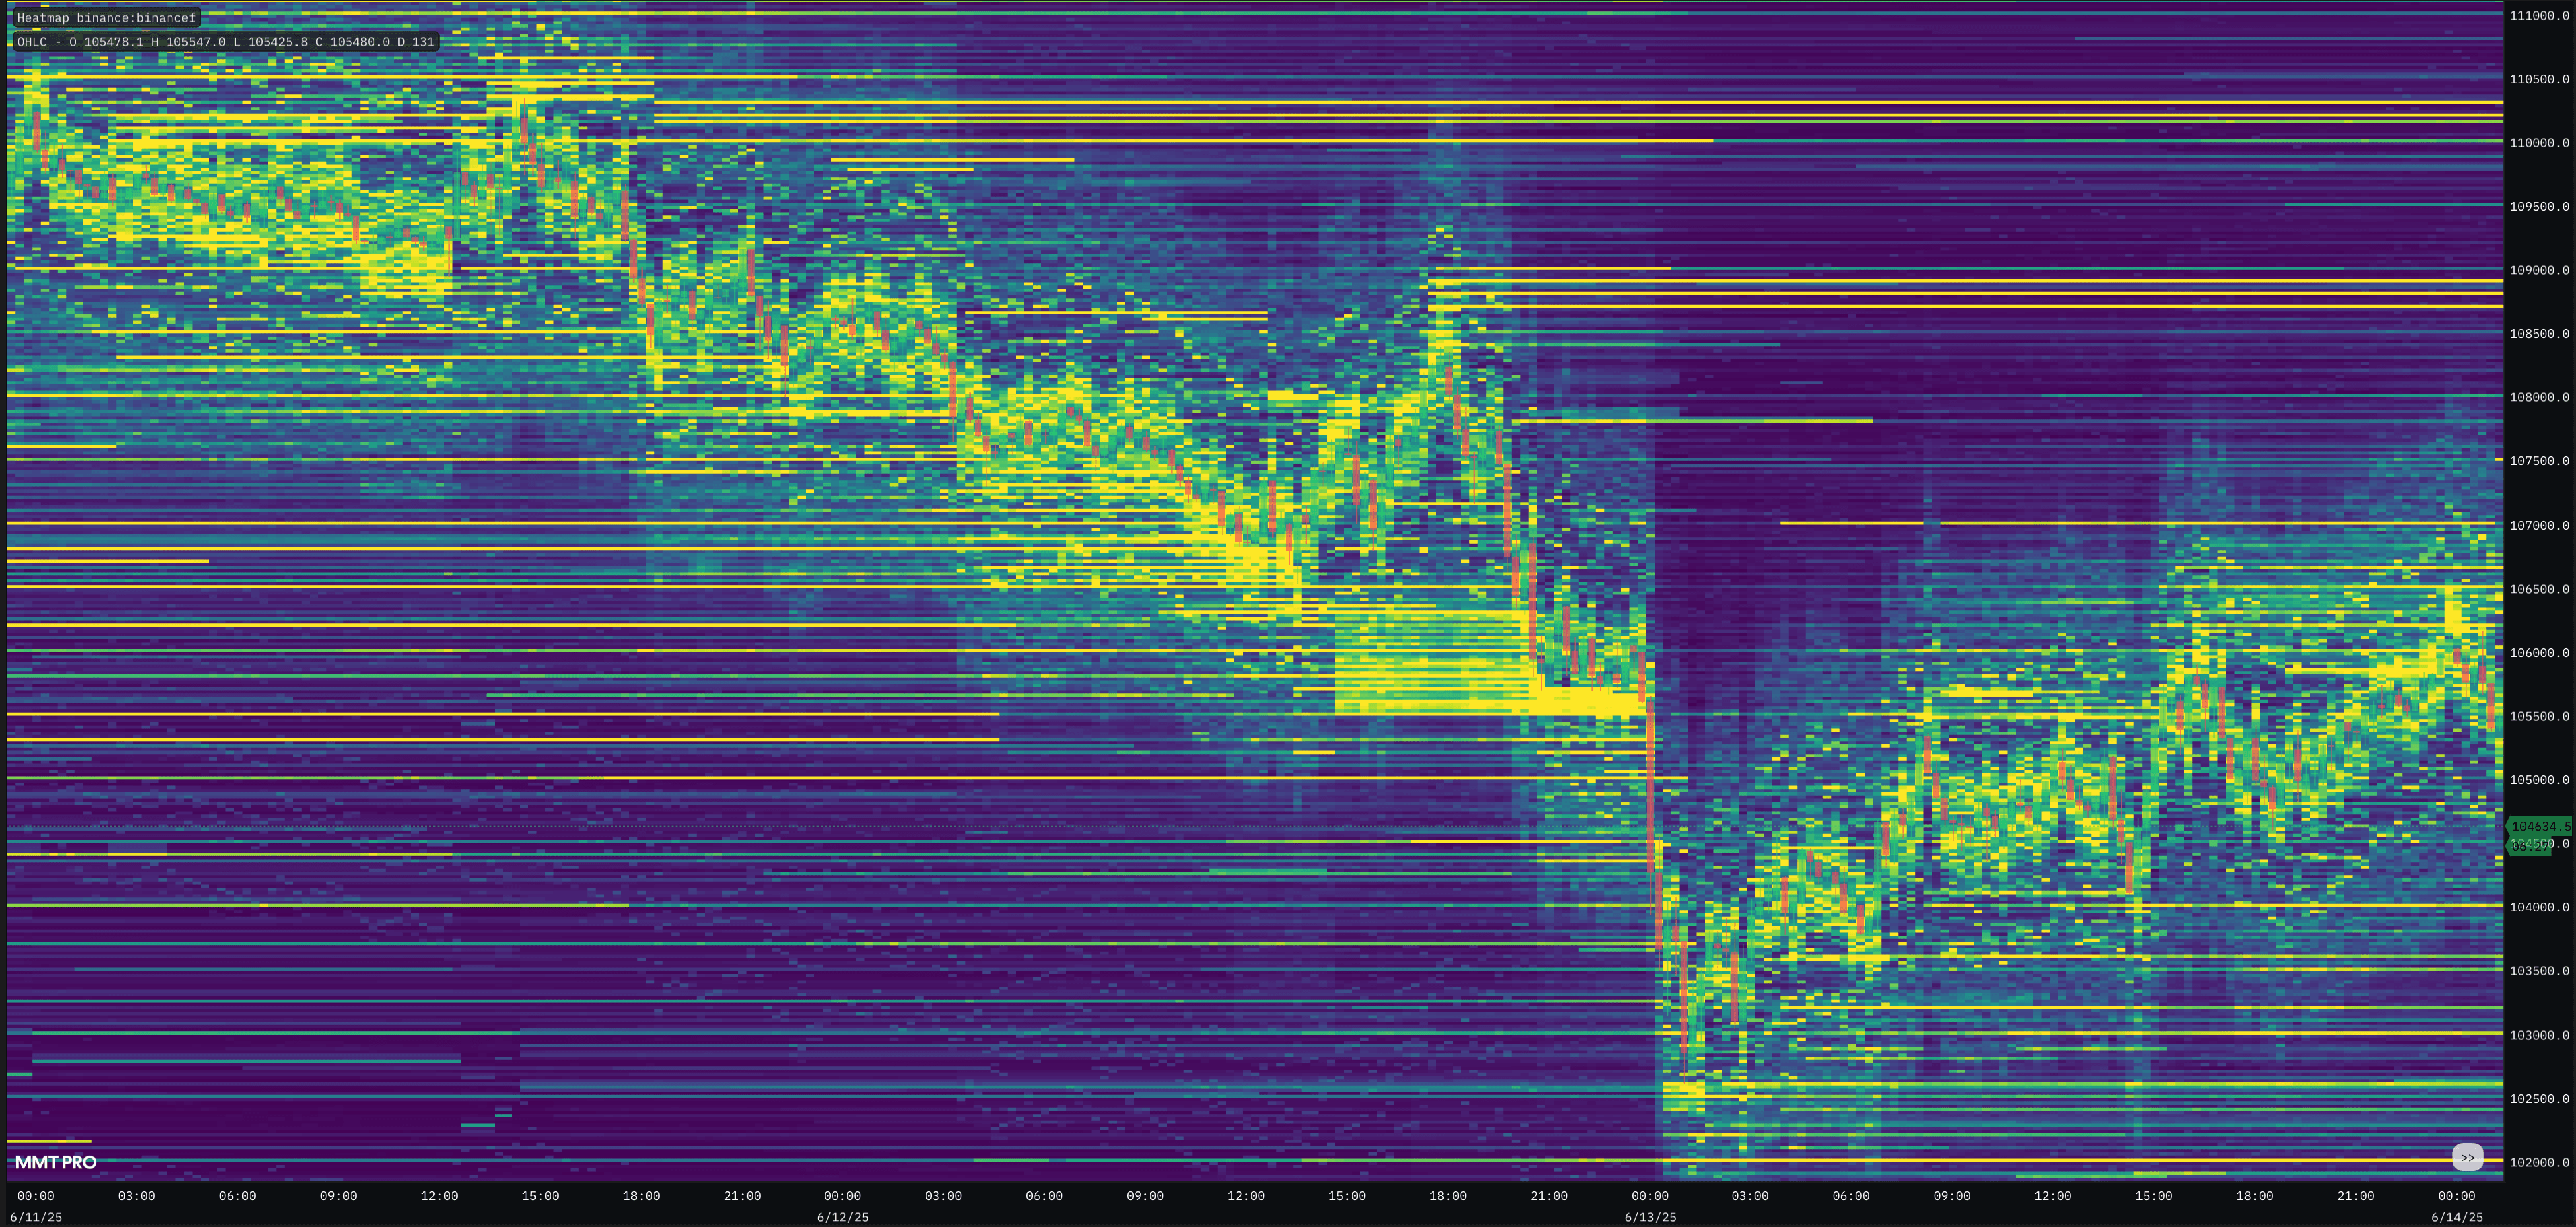
← SD vs HD →
Order Book Imbalances
Assess skew with the Order Book, to determine comparative liquidity conditions at varying depths of either side of the book.
TPO - Market Profile
TPO (Time Price Opportunity), also known as Market Profile, is a powerful tool in assessing price activity throughout the course of a particular period or session. Traditionally used on the 30m, each candle's price and duration is recorded to produce a profile.
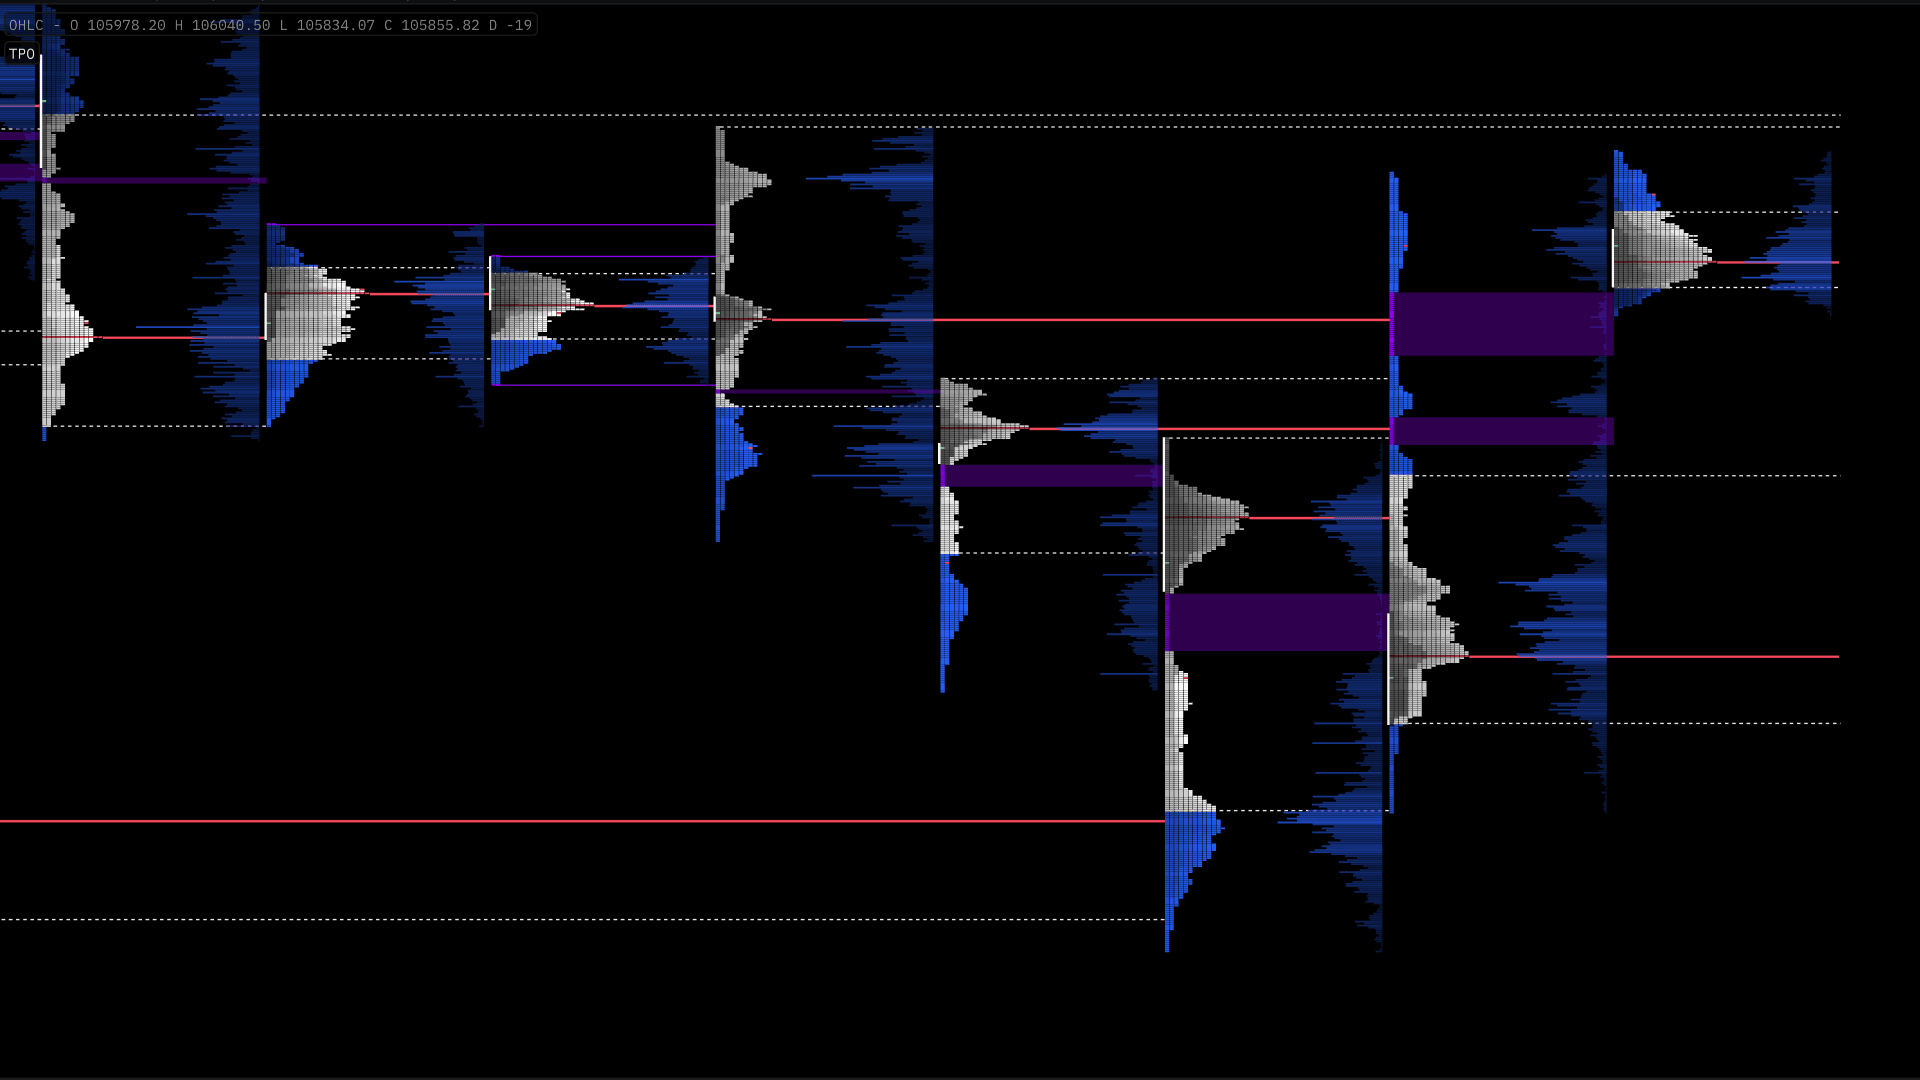
For more information on TPO / Market Profile - see the dedicated article coming soon.
Derivative Data
There are key data points that are present in derivative markets to be aware of. Inherently as contracts rather than underlying asset that are traded, there are ongoing obligations for market participants holding a position.
MMT monitors, records and serves these important data points for perpetual futures markets, that are published by the exchanges.
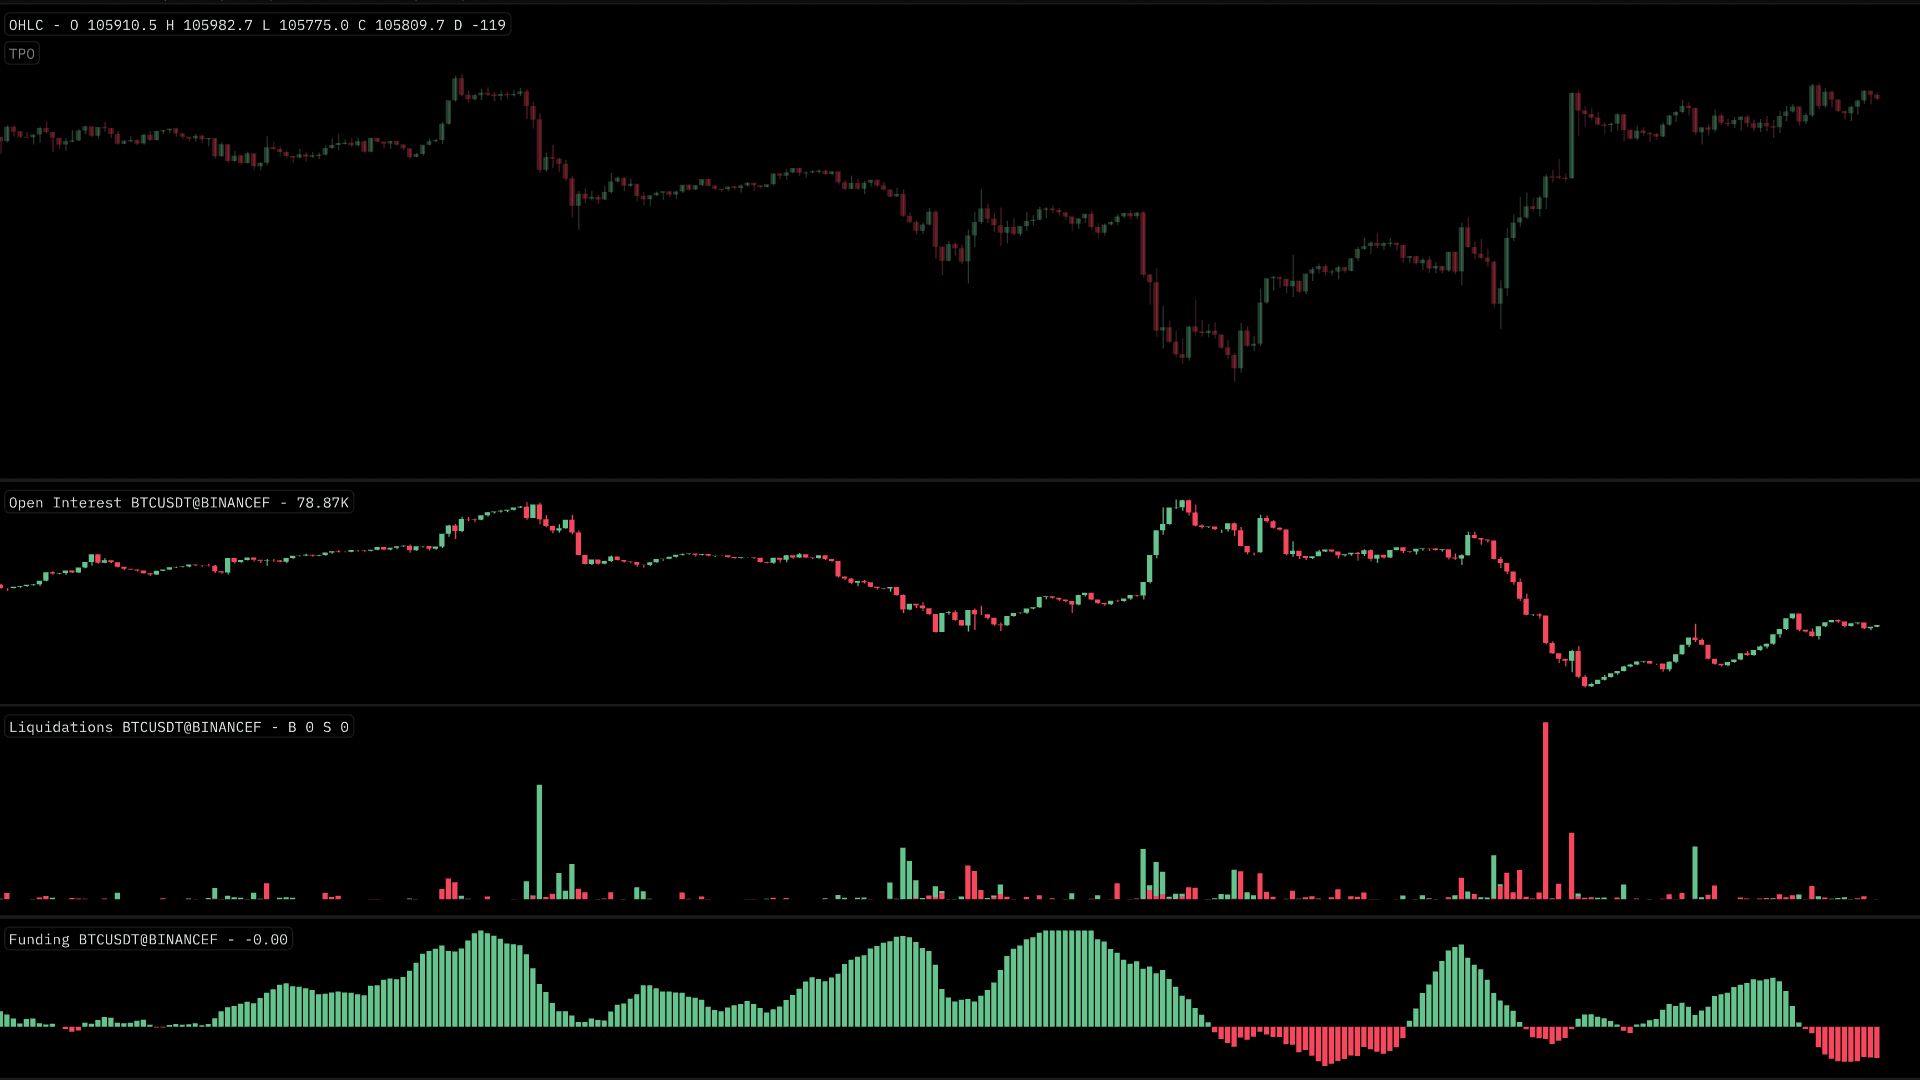
Open Interest - Tracks the change in the number of open positions within a futures market.
Liquidations - Monitors the value of positions that were force liquidated by the exchange.
Funding Rates - Records the +/- funding rate charged/received by those holding either long or short positions within the futures market.