Stats
Introduction
When searching for opportunities, having ability to assess key metrics from various markets in one place, minimises time spent on fruitless analysis. Traditional screeners or watchlists allow you to filter and sort through hundreds of markets. Whilst this step will initially produce a set of markets to consider, assessing which in particular to focus your attention, should be determined via live data.
MMT's Stats widgets use real-time data streams to provide an overview of key metrics. This flow of data can be directly compared live with other Stats widgets for other markets.
Stats Elements
The goal of the Stats widget is to provide actionable real-time insight into a particular market. Designed to be used in conjunction with other Stats widgets to allow comparison of key market metrics. Note that these some market metrics are cumulative in nature. This meant that the values for some of these metrics start accumulating from the time in which the Stats panel is opened.
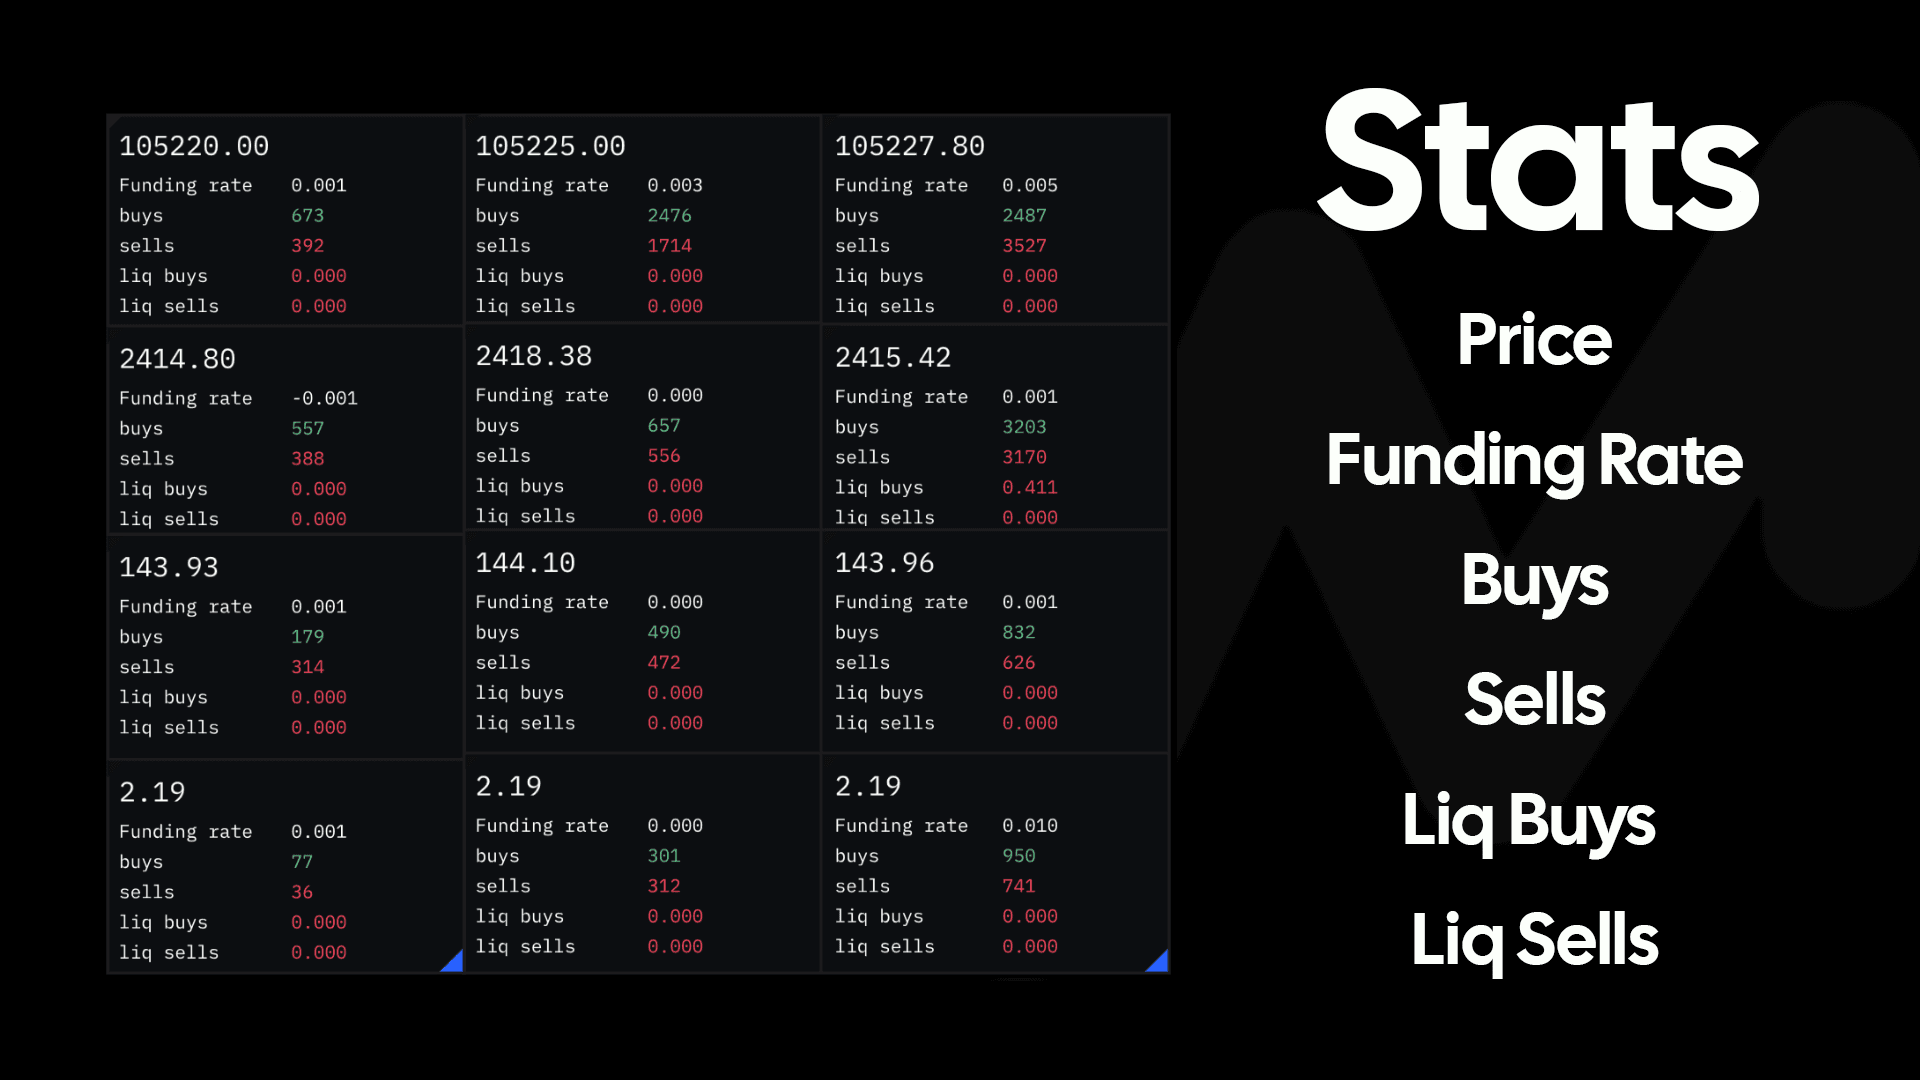
Price
First and foremost is the simple, yet important, Price element. Daily change in price/% will be added in coming update.
Funding Rate
A key core measure of market flow in perpetual markets, is the funding rate mechanism used to ensure contract's price does not deviate from the underlying index price. If the perpetual swap price is drifting above the index, the funding rate will be positive, to incentivise short positions over long positions. Equally if the perpetual swap price is drifting below the index, the funding rate will be negative, to incentivise long positions over short positions.
Buys & Sells
The Buys & Sells values shown are the cumulative number of trades that have taken place since the Stats widget was initially loaded. Please note these values are not volume, they are purely the number of trades, (or market orders) that have take place.
Liquidation Buys & Liquidation Sells
A cascade of liquidations within perpetual markets can often signal a potential reversal in price. As the liquidation engine takes forced control of trader's losing position to ensure the position is closed without counter-party loss, the value of these liquidation buys and liquidation sells are totalled
Buys vs Sells Skew
The final element of the Stats widget is the Buy vs Sell skew. The cumulative number of buy and sell market orders are compared as a ratio. This is then expressed visually in the form of a ratio bar graphic.
If there were equal value of each, the ratio bar would have an equal 50/50 split. As time progresses, this visual bar ratio will reflect the ratio between values shown within the Buys and Sells section of the Stats widget.
Activating the Stats Widget
Similar to all of the other MMT Widgets, the Stats widget button is located at the top of the MMT Terminal.
Upon selecting the Stats widget, the symbol selection sub-menu will be presented to determine which market the Stats panel should derive its data from. Once you have chosen your desired market, the Stats widget will appear. Once activated you are free to re-size and dock within your terminal to suit your preferences.
Stats Configuration & Settings
The Stats widget does not currently possess configuration options at this time. In future releases we plan to offer a greater selection of data streams for each market.