Volume
Introduction to Volume
After price itself, volume is arguably the second most important data point within a market. Transactions and the resulting volume is ultimately what dictates the direction of price.
Crucially, volume often indicates the level of market participants' interest, which is then reflected the total value of assets (or contracts) that were transacted. This is also often indicative of buying and selling pressure, particularly at key support or resistance levels.
Volume Elements
Whilst the volume indicator may appear familiar to most, there are a few distinct difference that you may discover are different from traditional 'Volume' you may have used elsewhere. In this section we will examine these difference so you are comfortable with this vital tool.
← 'Delta Highlight' vs 'Standard' →
Upon each new candle, the total value of market buys and the total value of market sells are monitored and recorded. From these 2 data points, the following information is rendered as histogram places at the bottom of your price chart:
Volume Modes
There are two distinct modes for Market Monkey's Volume layer, 'Delta Highlight' and 'Standard'.
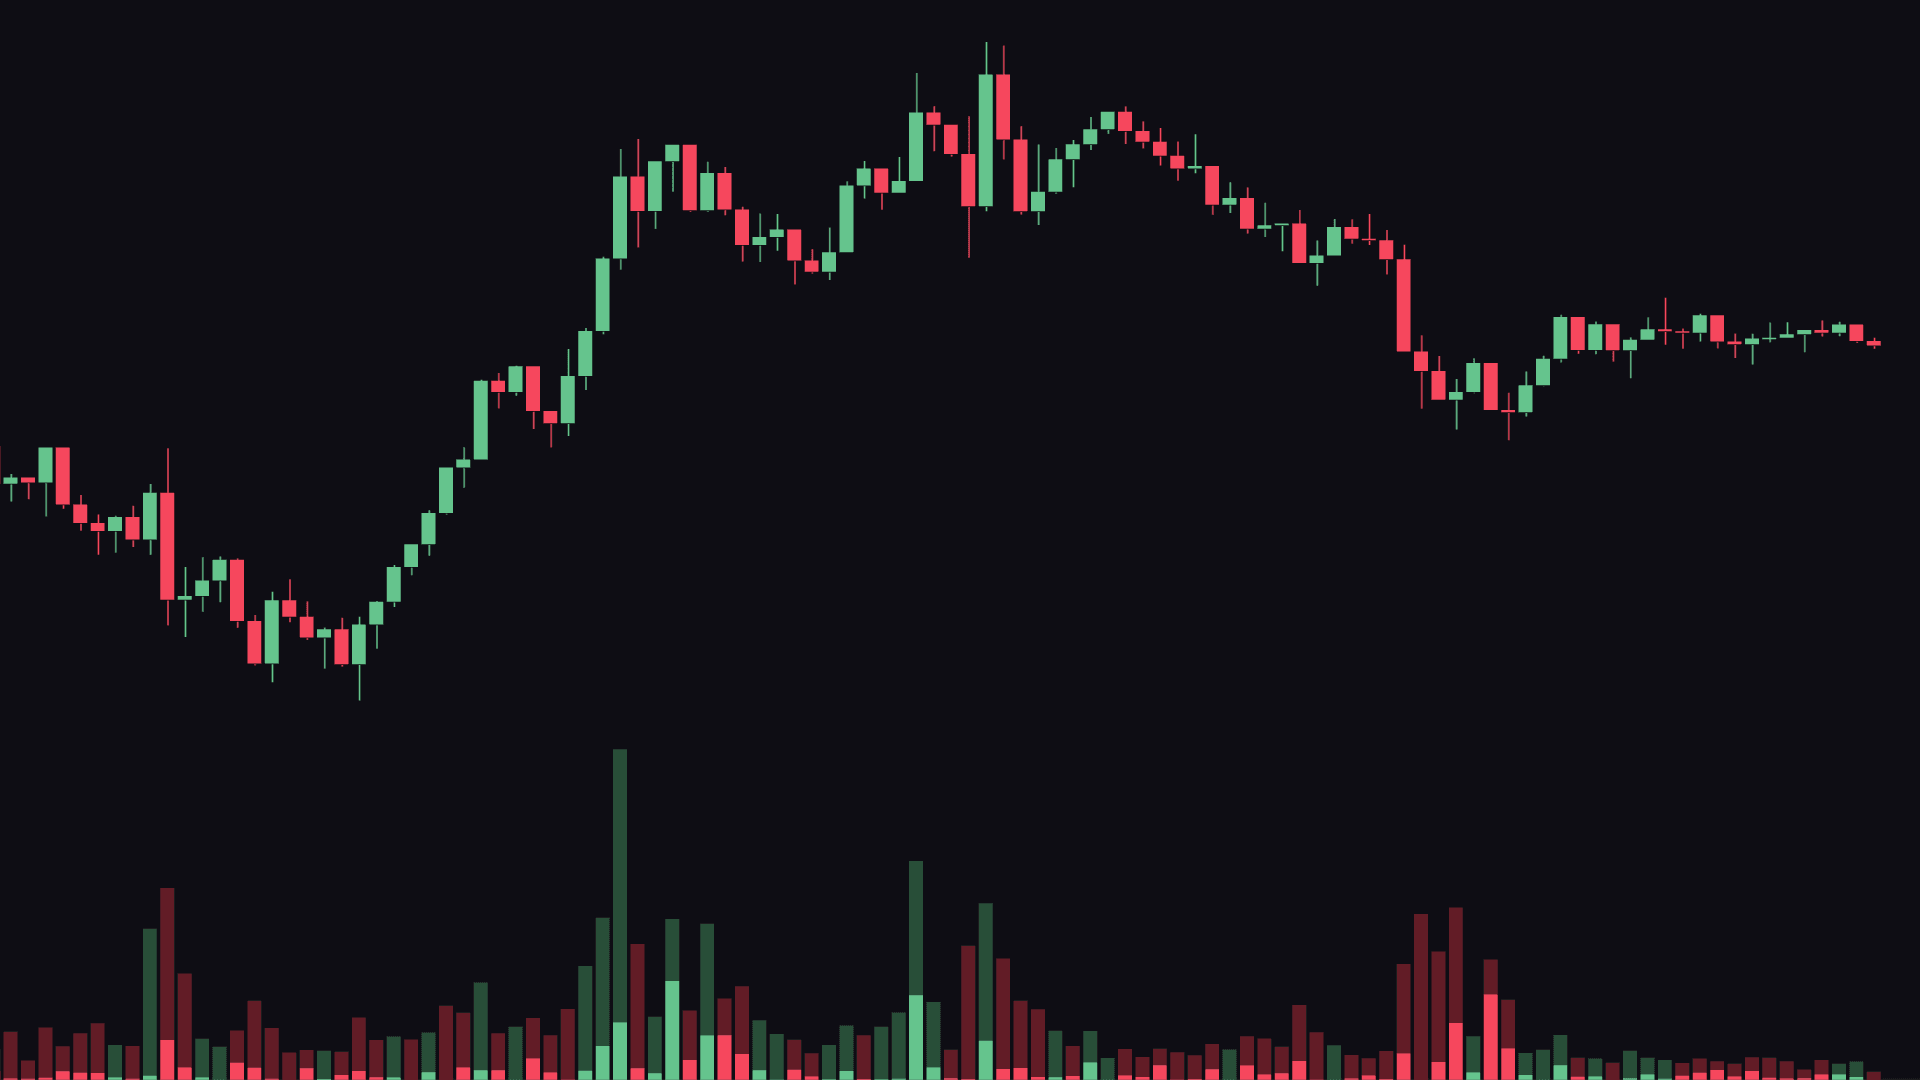
Delta Highlight
'Delta Highlight' mode provides distinct data points not present within the traditional (or 'Standard') method of viewing volume on your chart. Whilst there are some key differences to be aware of, the Delta Highlight is a valuable tool when assessing market volume.
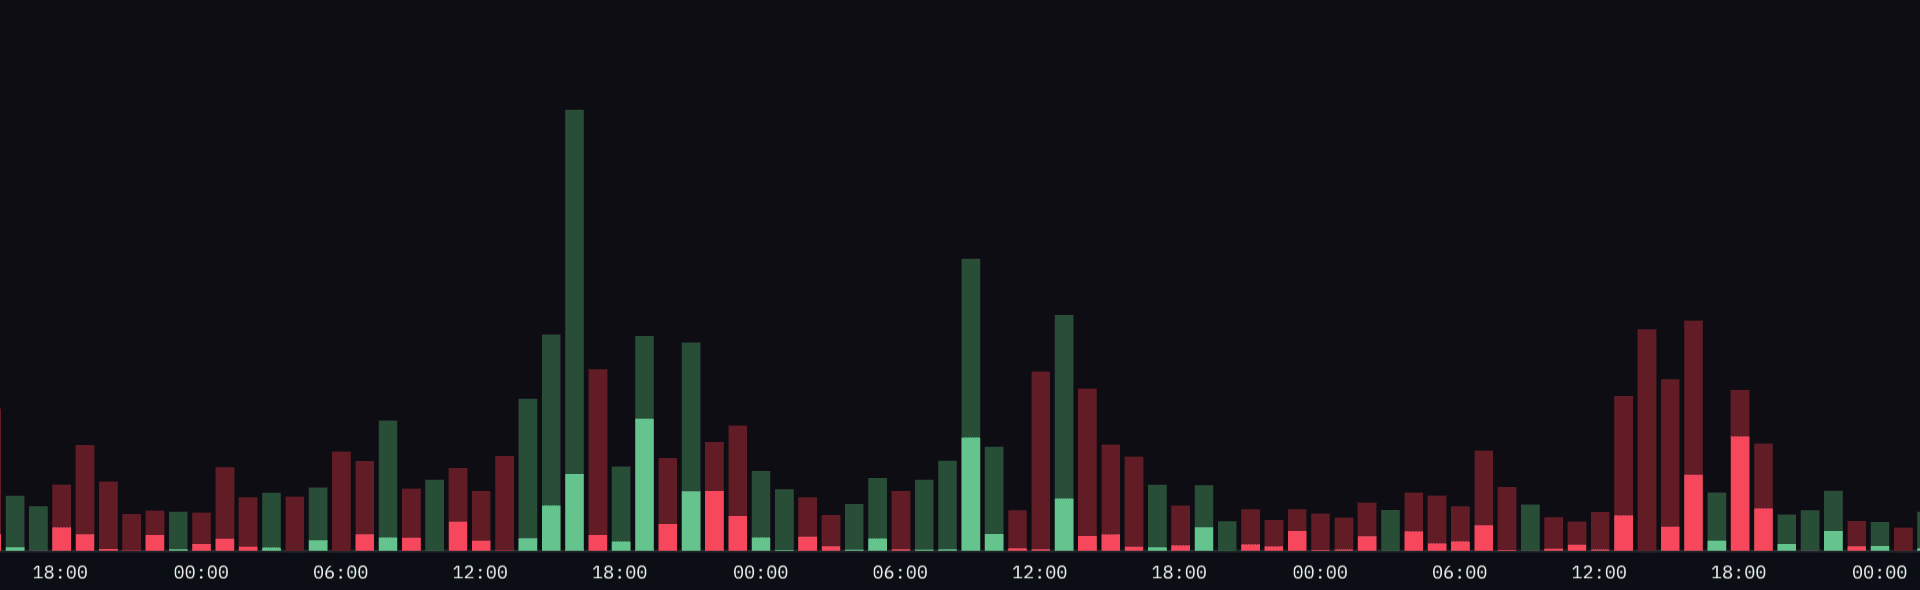
You will notice that there are two bars of varying heights for each node. There is both a darker bar placed behind a brighter bar of the same color.
In short, the darker bar represents the total market buy and market sell volume that was traded, with the brighter bar in front indicates the net delta between the two. Each of these are explained in more detail below.
Color - Delta
Each node of the histogram in Delta Highlight mode will be colored based upon an assessment of the recorded market buy volume and market sell volume. Each are totalled and compared with one another:
Market buy volume > market sell volume = Green Market buy volume < market sell volume = Red
This color choice will be applied to both the dark and bright bars within each node of the histogram.
Dark Bar: Height - Total Volume
The height of the dark bar of the volume histogram indicates the sum of both market buy volume and market sell volume. This sum produces the total volume. The higher the height of the bar within the histogram, the higher the total volume that was transacted in that time-frame.
Bright Bar: Height - Delta
You will notice a second brighter bar is plot in front of the dark total volume bar. The height of this bar indicates the net delta between the market buy volume and market sell volume. The greater the height of this brighter bar in front, the greater the delta that was recorded. This render also allows you to visually assess the proportionality of delta to total volume. The greater the deltas height (bright bar) as a proportion of the total volume height (dark bar), the greater the respective dominance of either the market buy volume or market sell volume.
Looking for CVD & Volume Delta? MMT has you covered. Check out the dedicated Cumulative Volume Delta and Volume Delta learn articles.
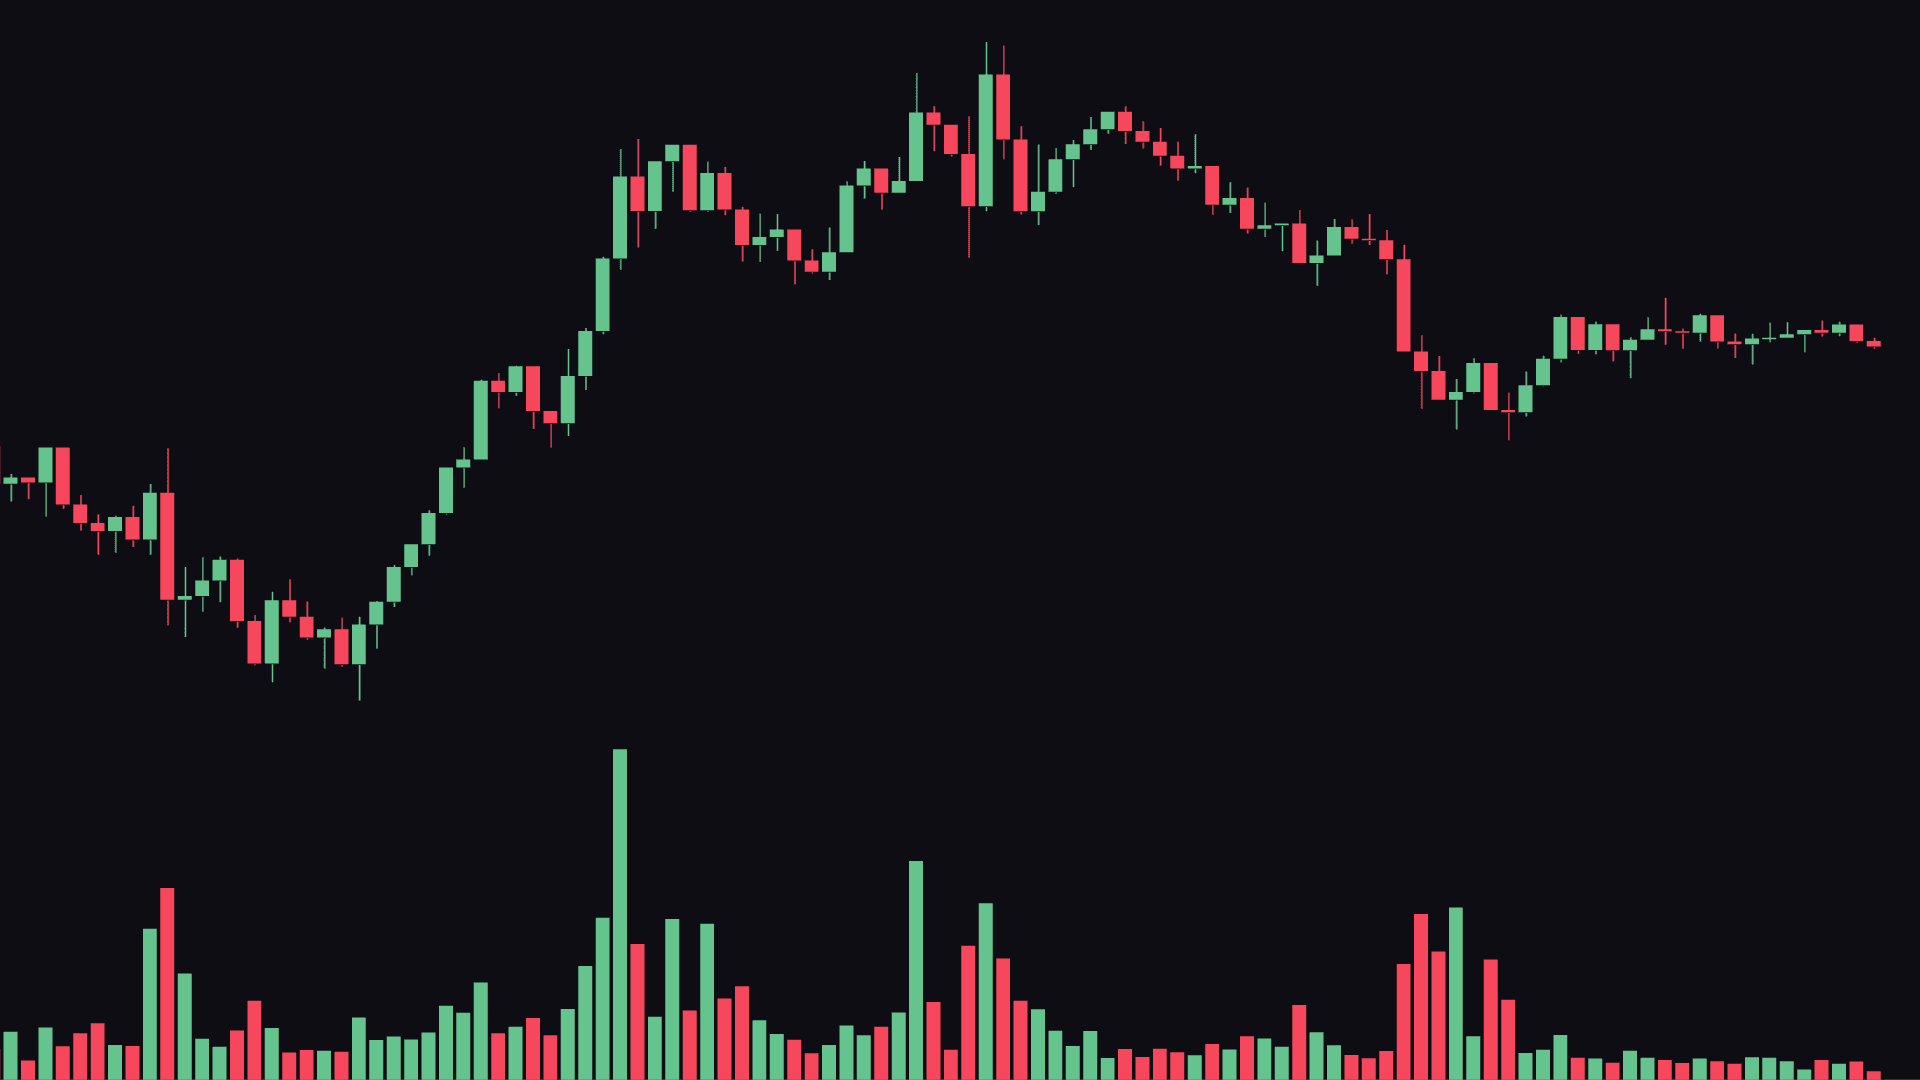
Standard
Those used to a more 'traditional' volume histogram can choose the 'Standard' mode. This mode is provide a familiar volume view that other chart platforms usually provide.
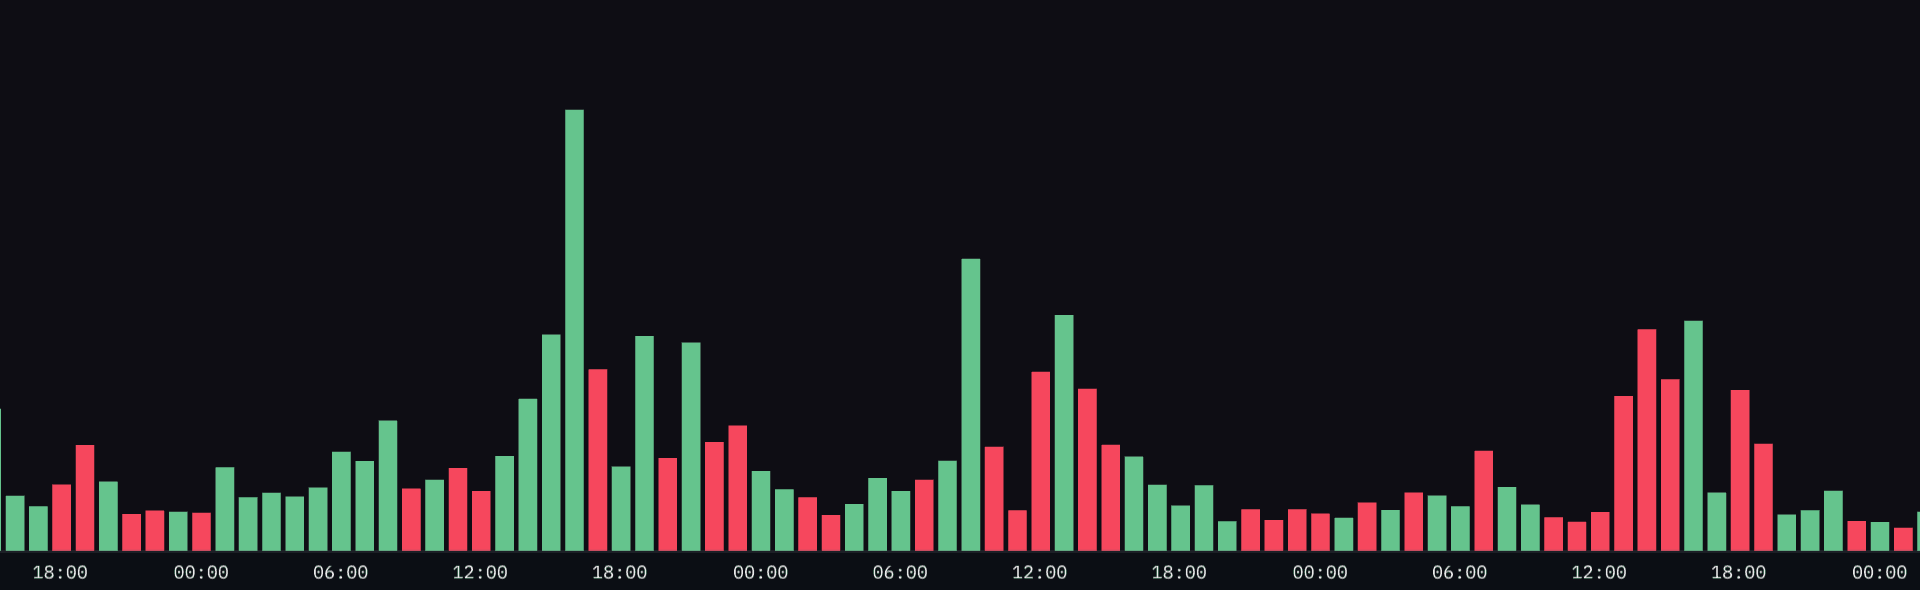
Color - Candle Close
The color of each node within the histogram is determined by the candle's closing price. This results in volume and the corresponding candle sharing the same color. If the candle closes lower than where it opened - both the candle and the histogram node will be colored red. If the candle closes higher than where it opened - both the candle and the histogram node will be colored green.
Height - Total Volume
Similar to 'Delta Highlight', the height of the 'Standard' volume histogram is the sum of the market buy volume and market sell volume within each candle. The higher the node within the histogram, the larger the amount of volume that was transacted in the candle.
Activating the Volume Layer
When opening a new Chart, the Volume layer will be added as part of the default chart template. To activate, navigate to 'Indicators' → 'Volume' to activate the indicator. This will be anchored to the bottom of your main price chart.
Volume Configuration & Settings
Volume Mode
This dropdown will switch between the default 'Delta Highlight' or 'Standard' volume views. The respective configuration options for each mode are the same.
Volume Color
This is the color used to indicate Market Buy Volume & Market sell volume. The color rendered will depend upon your your chosen volume mode.
Height Input
As the Volume layer is rendered as an anchor to the main price chart, a height input has been added. The input of this will represent the percentage of the main price chart window the volume layer's ceiling height will be capped to.