DOM - Depth of Market
Introduction
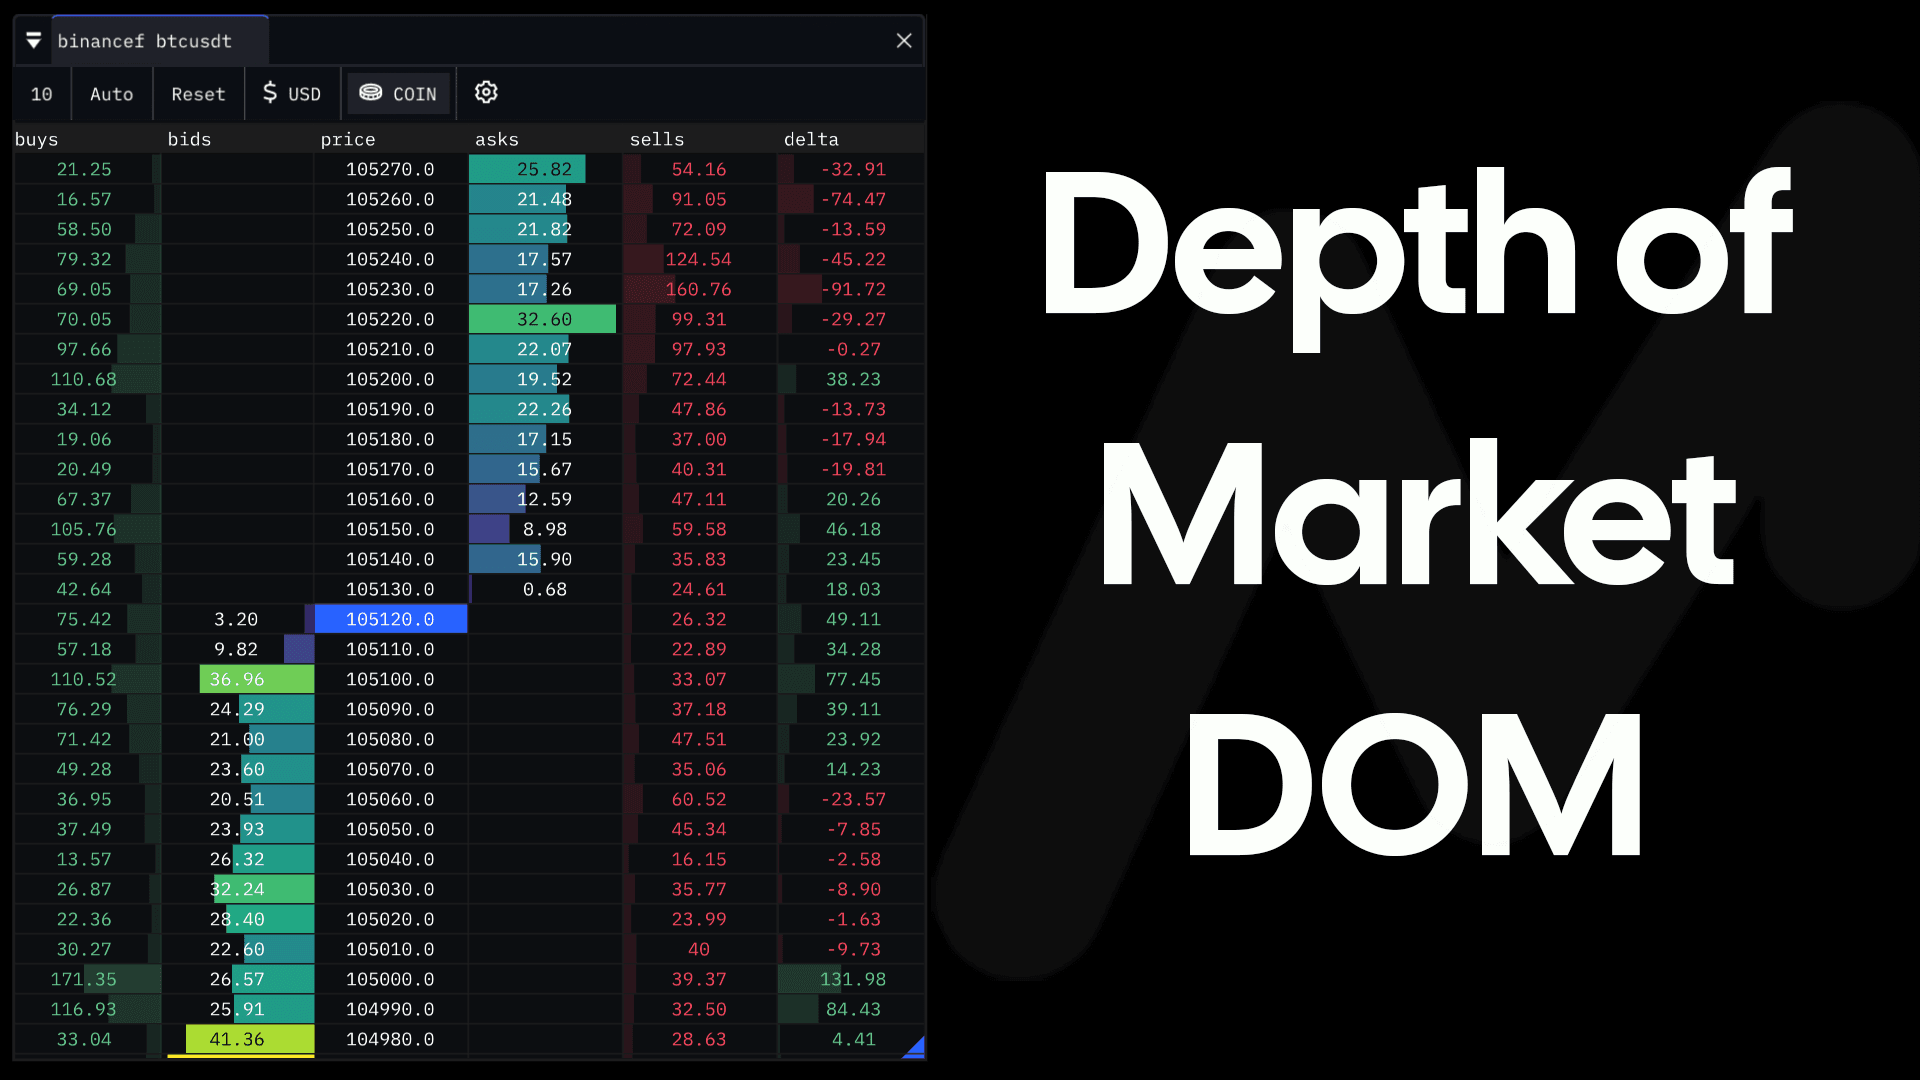
To assess liquidity conditions within a market, the Order Book can be examined to the determine where traders have placed limit orders to buy or sell. The distribution of sell-side liquidity (limit ask orders) and buy-side liquidity (limit buy/bid orders), will vary across prices.
Concentrated areas of liquidity can indicate prices in which large volumes of market orders can transact efficiently, with minimal impact to price.Whereas, gaps or lower areas of liquidity can indicate that prices in which market orders may experience in-efficient execution, via slippage.
To visualize the interactivity of both limit and market orders, the DOM pairs the each level of the order book, with market volume data. Displayed as a profile, the market buy and market sell data indicates the volume transacted previously, at each price level of the Order Book.
DOM Elements
Let's explore and break down each of the various elements of the DOM available on MMT.
Order Book
The order book is shown in the center of the DOM widget. The middle column shows each price level within the order book. You will notice a blue highlight to indicate the last price in which a trade took place.
Either side of price, are the current value of Bids (right of price) and Asks (left of price), at each respective price level.
Those familiar with MMT's Heatmap layer will be familiar with the color scheme and grading used for the bid and ask columns.
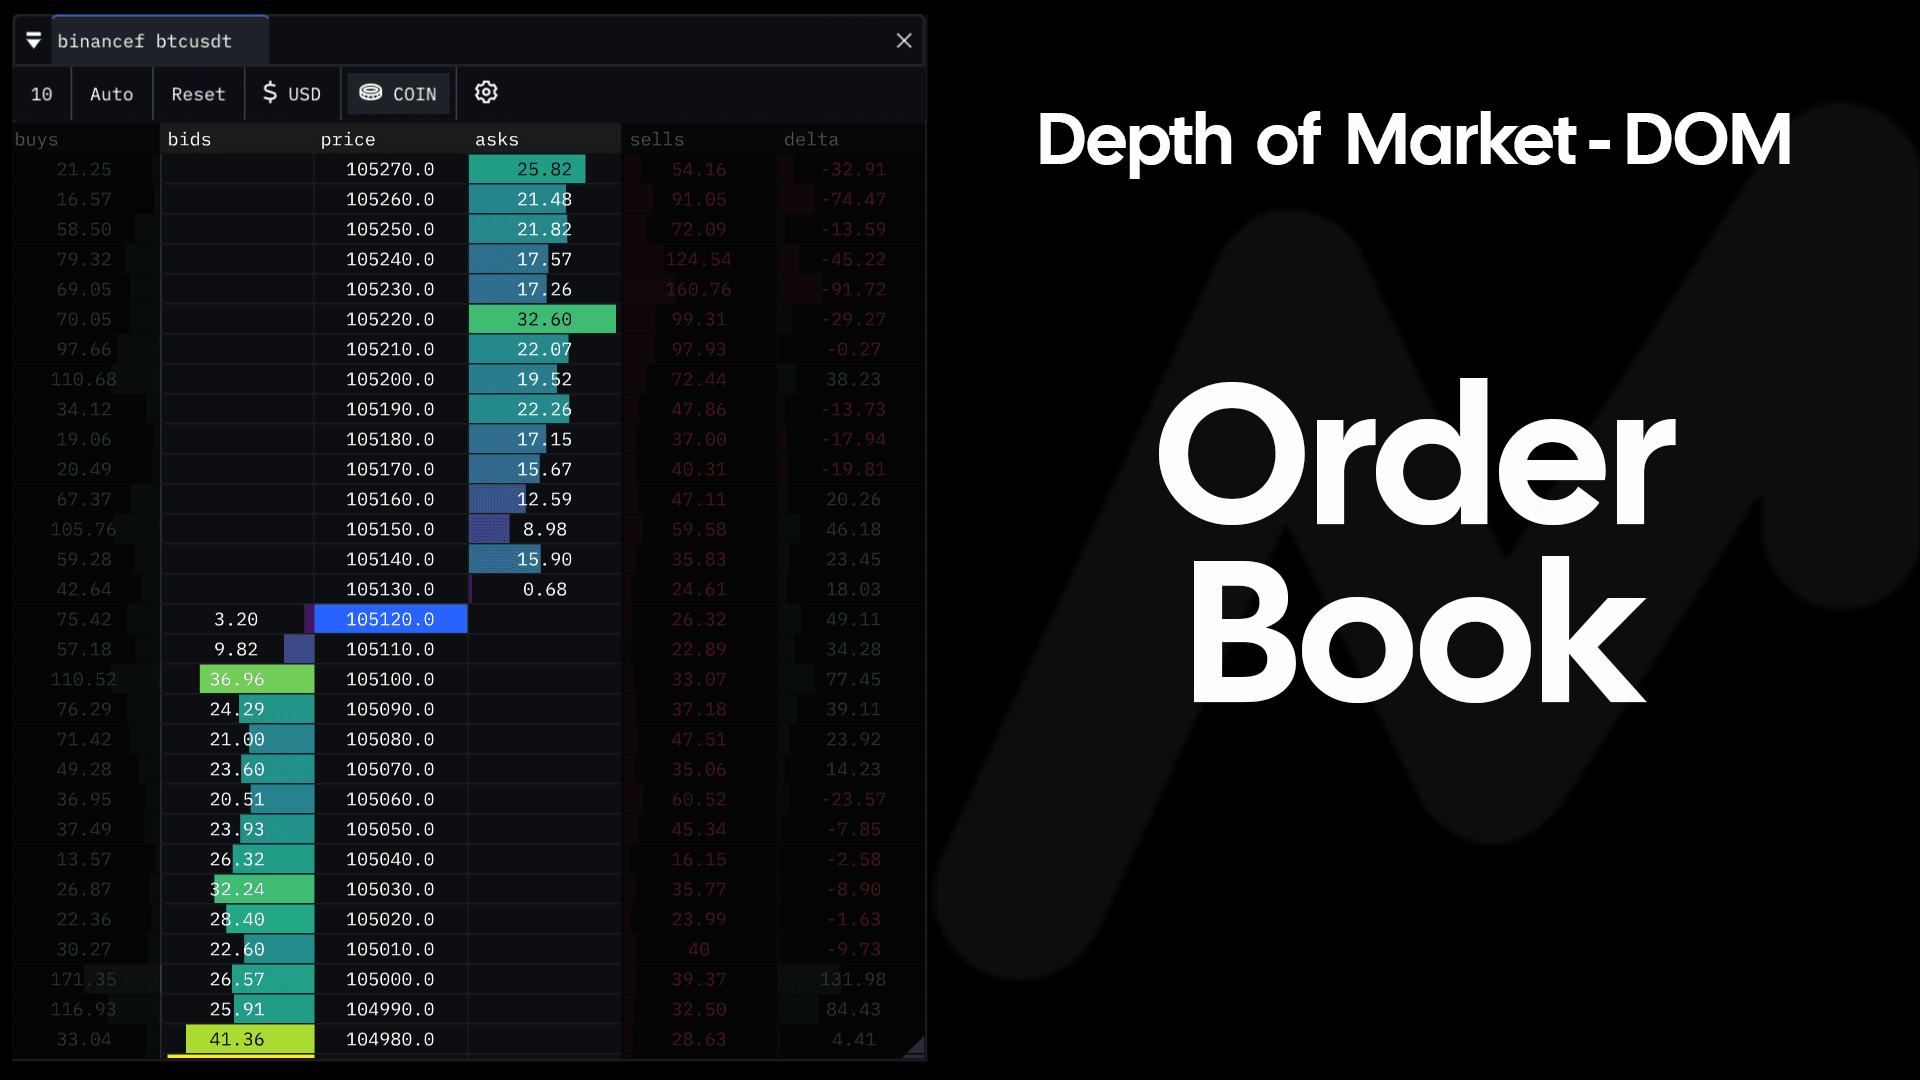
To visually aid you, the cumulative value of limit orders at each level within the orderbook has been color graded. The brighter the color, the larger the value of limit orders at that particular price level. Conversely, the smaller the value of limit orders at a particular price level.
Buys, Sells & Delta Profiles
Accompanying the Order Book element of the DOM, is a historical record of the market order volume. This is calculated cumulatively, from the time in which the DOM widget was loaded.
Visually displayed as a profile, the cumulative value of market buy & market sell volume is shown for each price level of the Order Book. By default, these values are the unit value of the selected market.
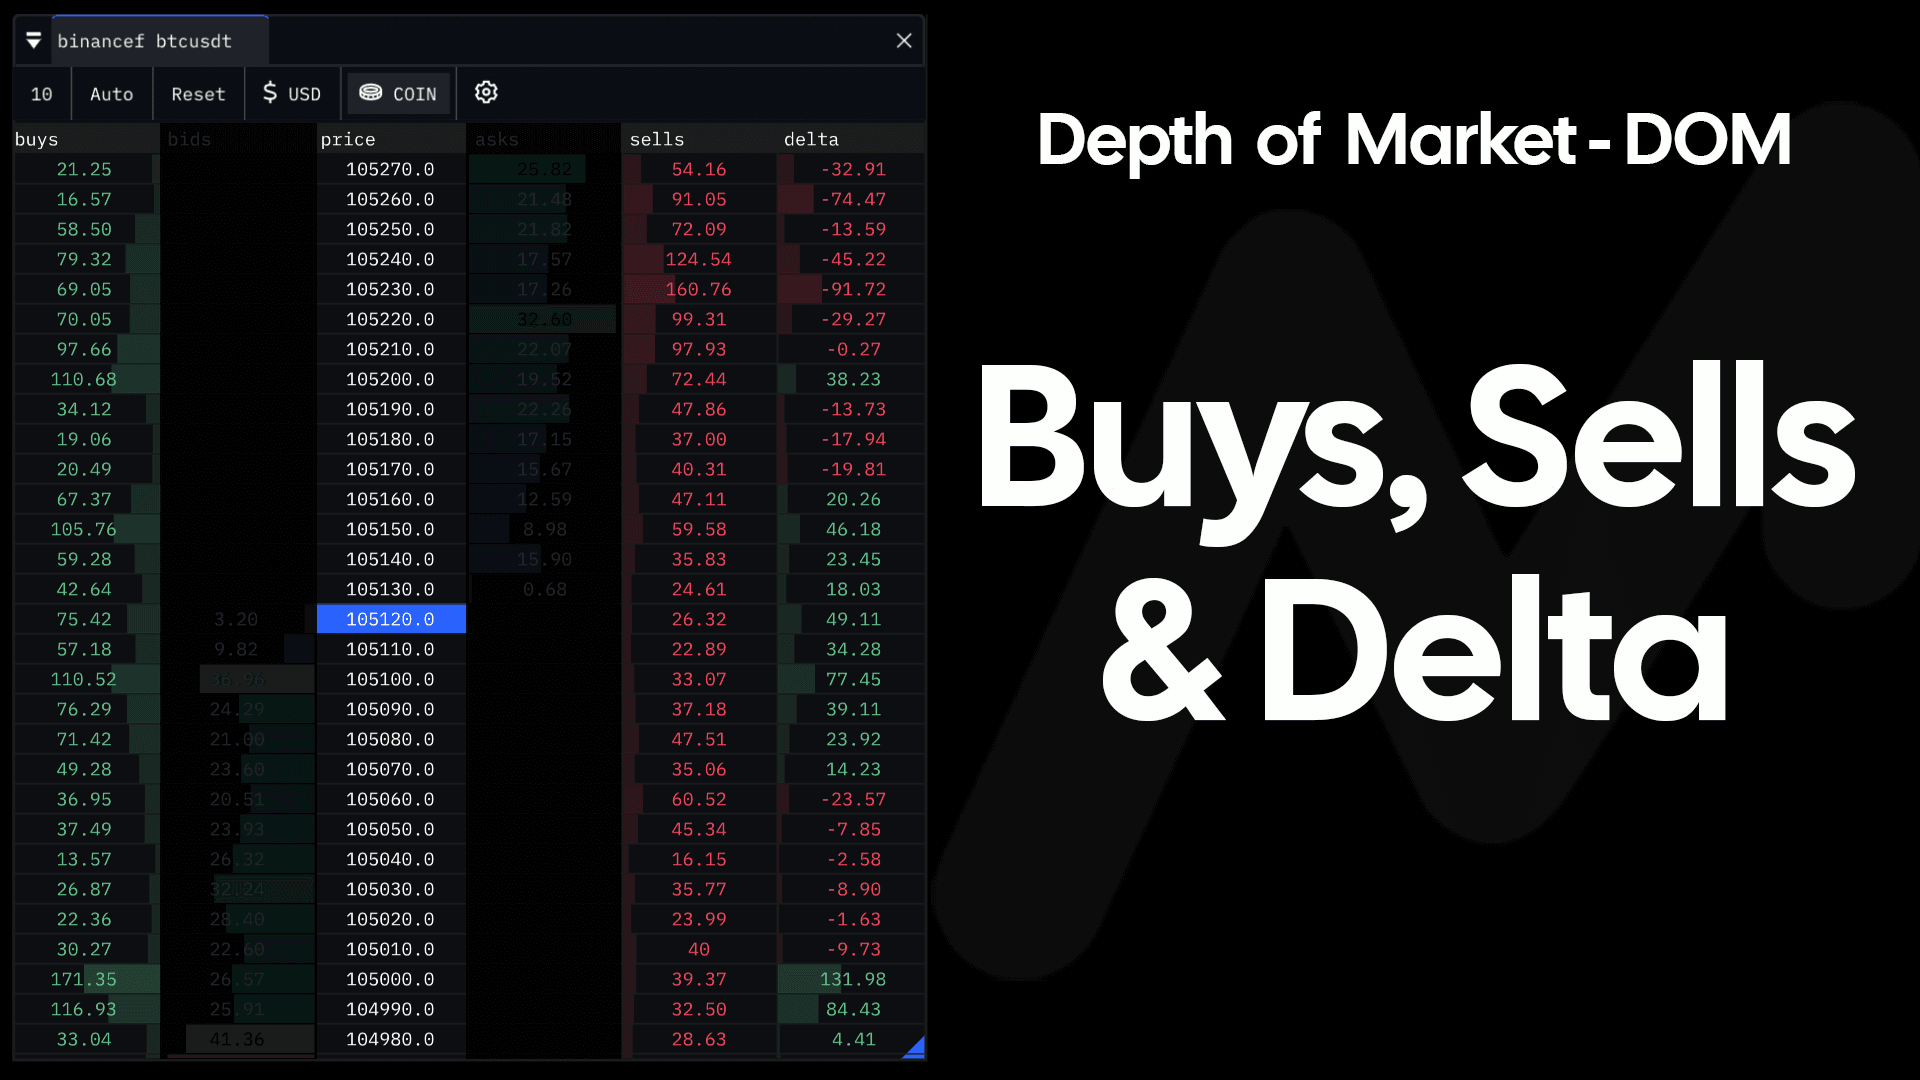
By default the far right column shows the Delta of market buys and market sells.
If positive, market buy volume exceeded market sell volume at this price. If negative, market sell volume exceeded market buy volume at this price.
Collectively, the background of each cell of the Buys, Sells & Delta columns, form each respective volume profile. Often you will find that nodes of previously low market volume, are often followed by interest at these prices within the order book.
Activating the DOM Widget
As with all MMT Widgets, the DOM widget can be found in the main menu at the top of your MMT Terminal.
Clicking on the DOM widget button, will open the symbol selection sub-menu.
Once activated you are free to re-size and dock the DOM within your terminal to suit your preferences.
DOM Configuration & Settings
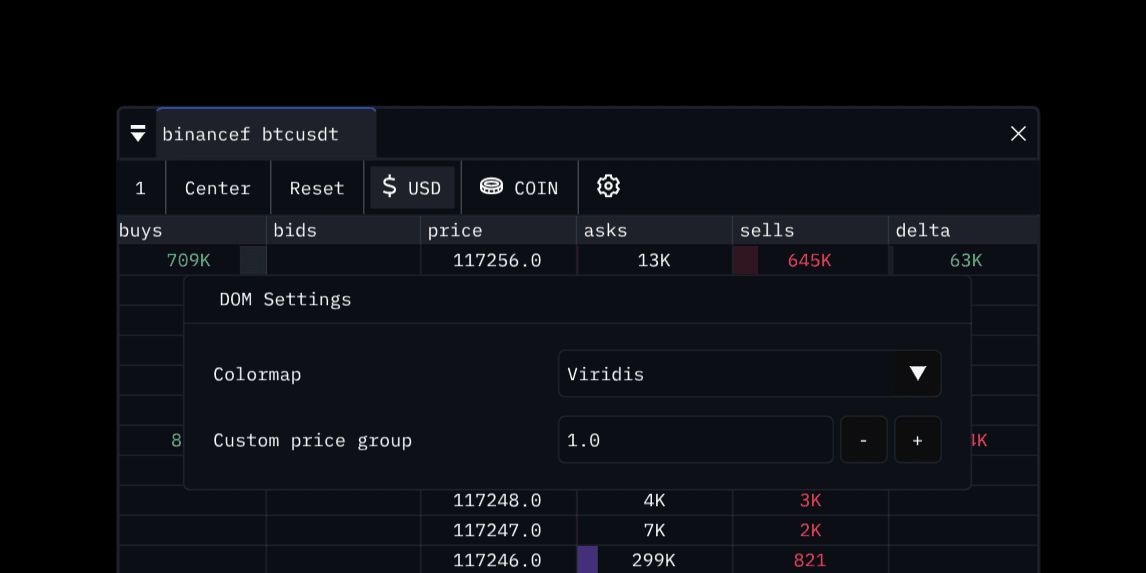
Price Grouping
This input determines how the price levels within the Order Book are grouped. A higher grouping value will aggregate price levels of the Order Book. By default, the DOM will always use the lowest possible tick size.
Centred / Auto Alignment
As price moves, you can choose how you wish the orderbook should be positioned on your screen.
- In 'Center' mode, the current price will always be fixed at the vertical center of the height of the DOM widget.
- In 'Auto' mode, price will move in the direction of the market. Once price has moved within its grouping by over 25%, the orderbook will shift along in the same direction.
Colormap / Theme
All of your favourite colormaps and themes from the MMT Heatmap are available within the DOM.
USD / Coin Unit Value
By default the displayed values within the DOM widget are shown in the respective pairs' native unit value. Toggling between USD / COIN Unit Value selector will transform all values shown within the widget.
Reset
Clicking the 'Reset' button will clear all values from the Buys, Sells and Delta columns, including their respective profiles. Note that once 'Reset' there is no way of recovering these cumulative values.