VPSV - Volume Profile Session Volume
We recommend prior to reading this VPSV article that you familiarize yourself with concepts explained in the VPVR - Volume Profile Visible Range documentation.
Introduction
Order Flow traders will often use a variety of tools to view the distribution of market buy & and market sell volume. Footprint charts allow you to perform this analysis on an intra-candle basis. If looking to assess across the entire price-range currently with the view, VPVR is the tool for the job.
VPSV - Volume Profile Session Volume on the other hand, performs this distribution analysis, on a session basis. Separating order flow into sessions allows analysis to be conducted on a localized basis. Often previous' day's distributions as often tested in the subsequent days after.
Traditionally, each session is a defined period for example, 1 daily trading session. With crypto markets, this would be a full 24 hour period starting at 00:00 UTC.
VPSV Elements
The primary difference of VPSV in comparison to other profile tools, is the 'session' element. Traditionally, each session is a defined period for example, 1 daily trading session. With crypto markets, this would be a full 24 hour period starting at 00:00 UTC.
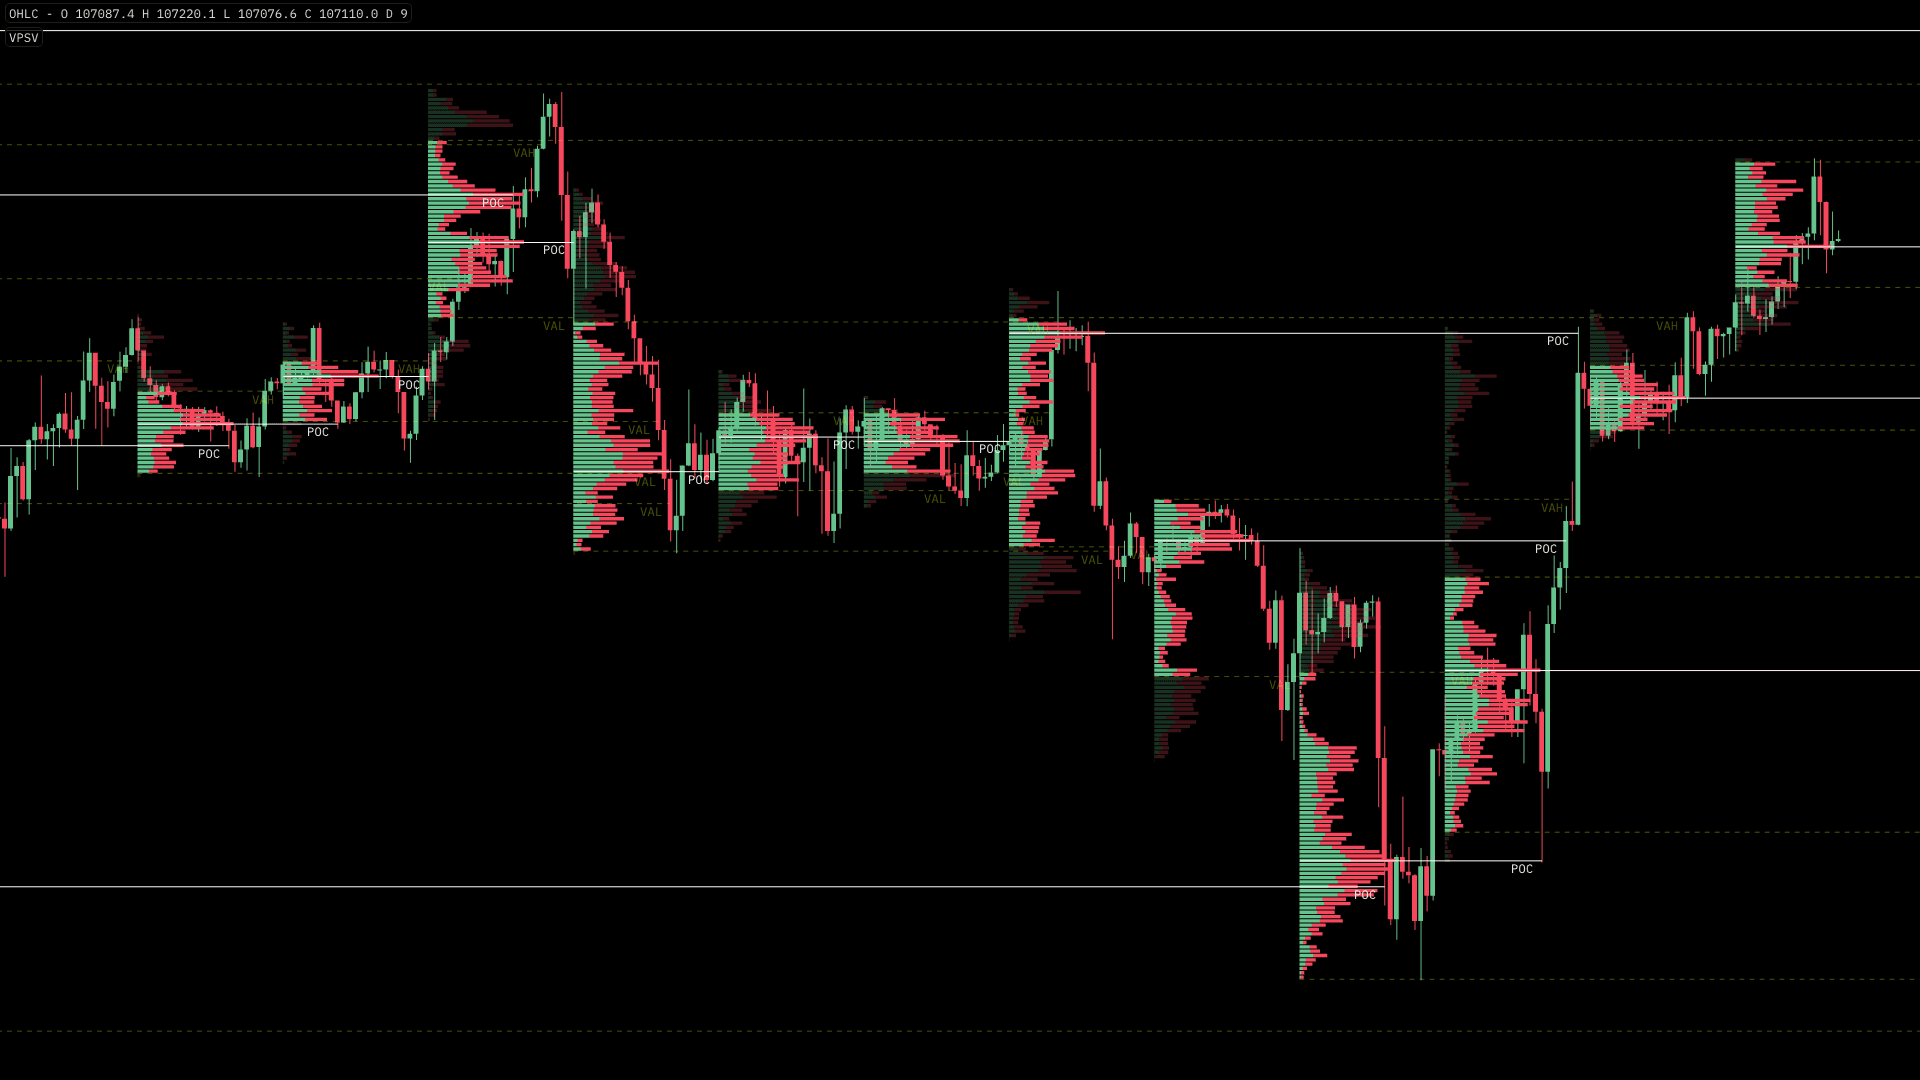
Point of Control - POC
The Point of Control highlights the POC the price level where the largest volume was transacted within the specified session. This will be indicated by the widest row within each of the VSPV renders.
POC - Naked Extension The POC prices of a previous session are often re-tested in a subsequent session. To aid in this, you can enable a 'Naked Extension' of previous sessions's POCs.

This will render the POC from each session into the future indefinitely, until re-tested by price
Value Area / VAH & VAL
The Value Area is traditionally defined as the area in which 68% of the total volume occurred. Within the context of VPSV, this would mean 68% of the total volume that occurred within the respective session.
VAH & VAL - Naked Extension Similar to previous session's POC prices, Value Area Highs (VAH) & Value Area Lows (VAL), can often experience a reaction within subsequent sessions.

Again, like POC, you can enable 'Naked Extension' of all VAHs & VALs on your chart, which will continue into the future until price intersects in future.
Activating the VPSV
To activate VPSV, head to the 'Indicators' tab and select 'VPSV'.
VPSV Configuration & Settings
Tick Per Row
The Tick per Row input will modify the price grouping used to determine the height of each row within the profile. The larger the value entered, the larger the price grouping and subsequent height of each row within the profile. This setting should be adjusted to suit the timeframe you are examining.
Bar Width
This determine the width of the profile. The higher the value entered, the wider the profile is rendered. Width is restricted to 1 - which would result in the end of Point of Control row finishing at the very start of the next sessions profile.
Bull Color
This is the color that denotes Market Buy Volume. By default this is set to Green.
Bear Color
This is the color that denotes Market Sell Volume. By default this is set to Red.
Show Naked Values
When one or more of the Naked Extension options have been enabled, this toggle will enable these naked prices to be shown within the Y-axis.
Show POC
When toggled a white horizontal ray will be drawn for the Point of Control, of each VPSV profile rendered. By default this is enabled.
POC Line Color
Color picker for Point of Control. The default color is white.
POC Line Thickness
Determine the weight or thicccness of the Point of Control ray. This can prove useful when you have multiple layer's overlaid on your chart.
POC Naked Extension
Often, previously established Point of Controls are often re-tested by price in the future. To aid in visualizing these previously untested POCs, the 'Naked Extension' option is used to extend these untested price levels indefinately until they have been retest by price in the future.
Value Area %
The input entered will determine the % threshold of the total volume traded over the visible range to be considered as part of the 'Value Area'. By default this is set to 68% which is equal to one standard deviation. Another commonly used input is 70%.
Show Value Area Rays
When enabled, two rays, each representing the respective Value Area High & Value Area Low (VAH & VAL), will be displayed for each rendered VPSV.
Value Area Line Color
Color picker for Value Area Rays. The default color is white. Labels indicating the Value Area High & Value Area Low (VAH & VAL)
VA Naked Extension
Whilst not as statistically significant, previously untested Value Area Highs (VAH) & Value Area Lows (VAL) can often see a reaction by price. To aid you in this, Value Area High & Lows from all rendered VPSV profiles can be extended indefinitely until they have been retest by price in the future.