CVD - Cumulative Volume Delta
CVD Introduction
Cumulative Volume Delta (CVD), is volume based indicator that calculates the net difference between market buying and market selling pressure over a particular time frame. Upon each new candle, the volume delta between market buy volume and market sell volume is determined.
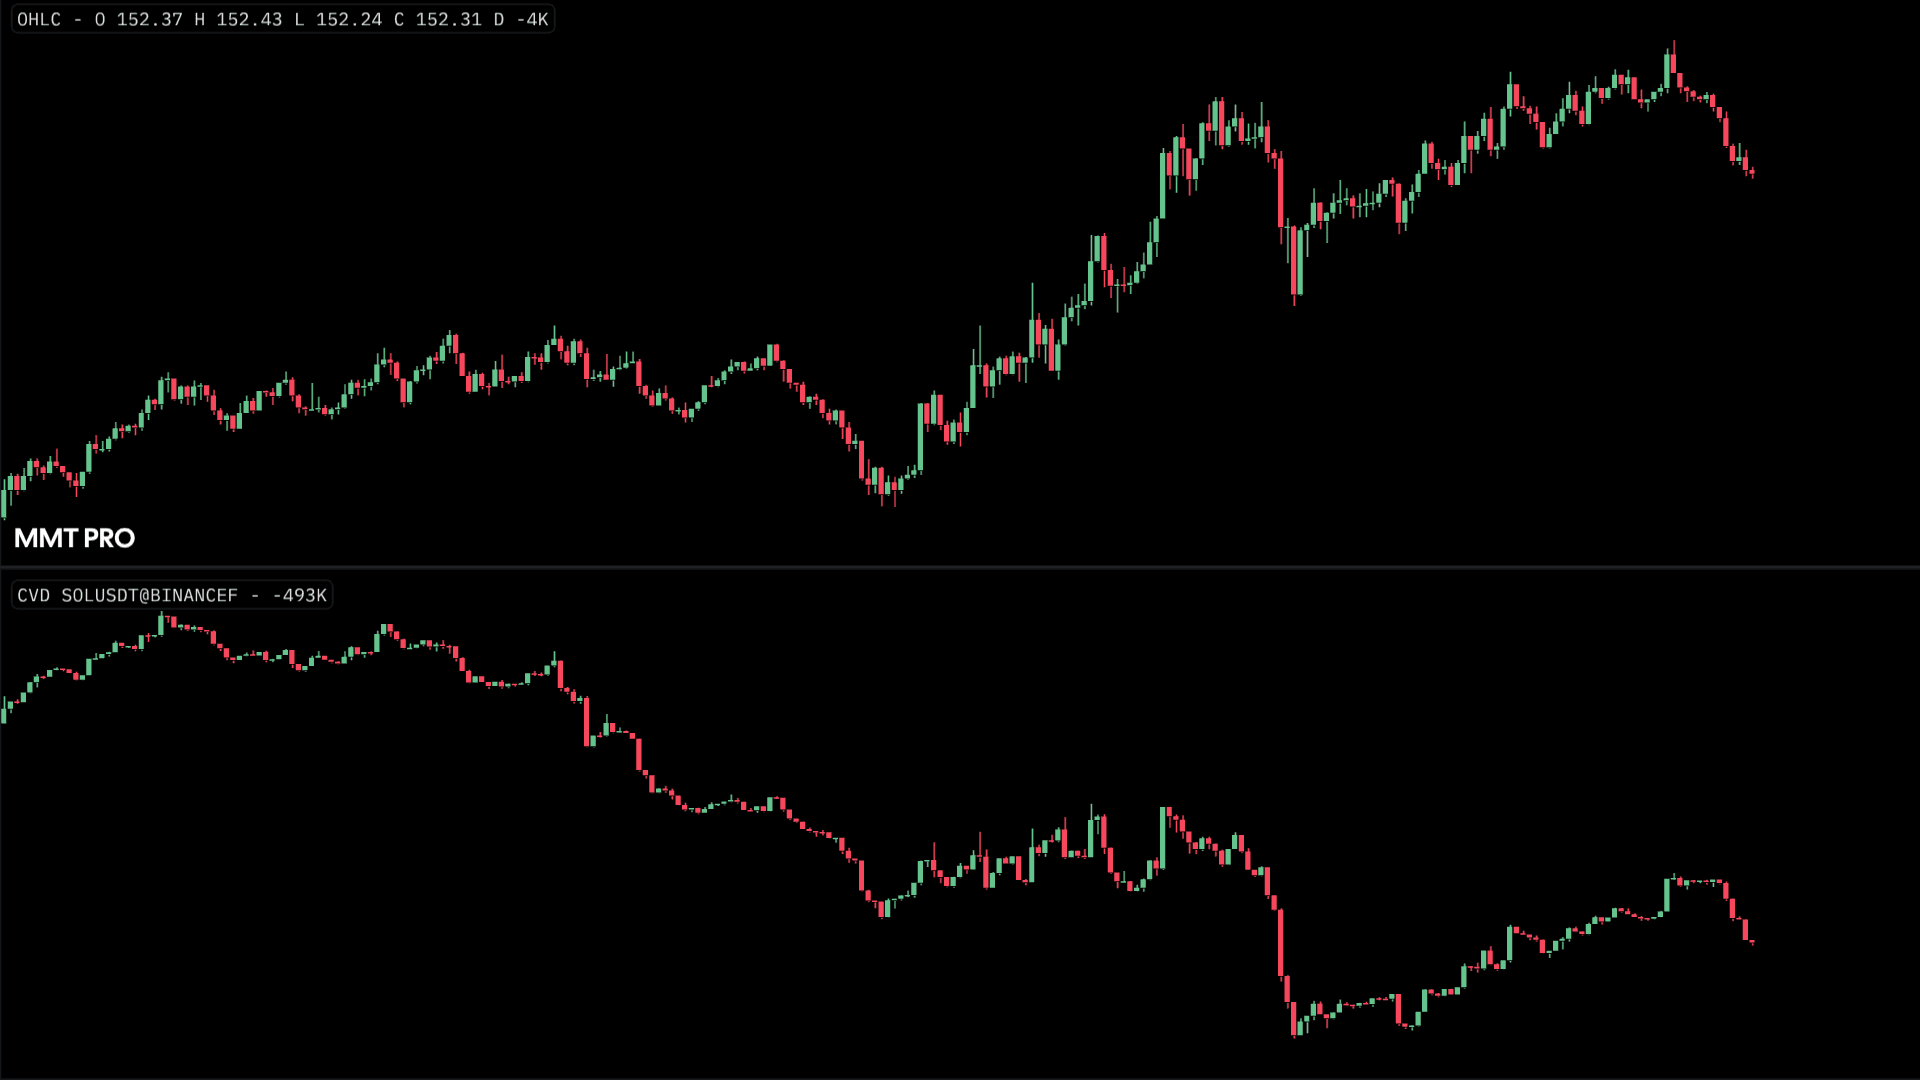
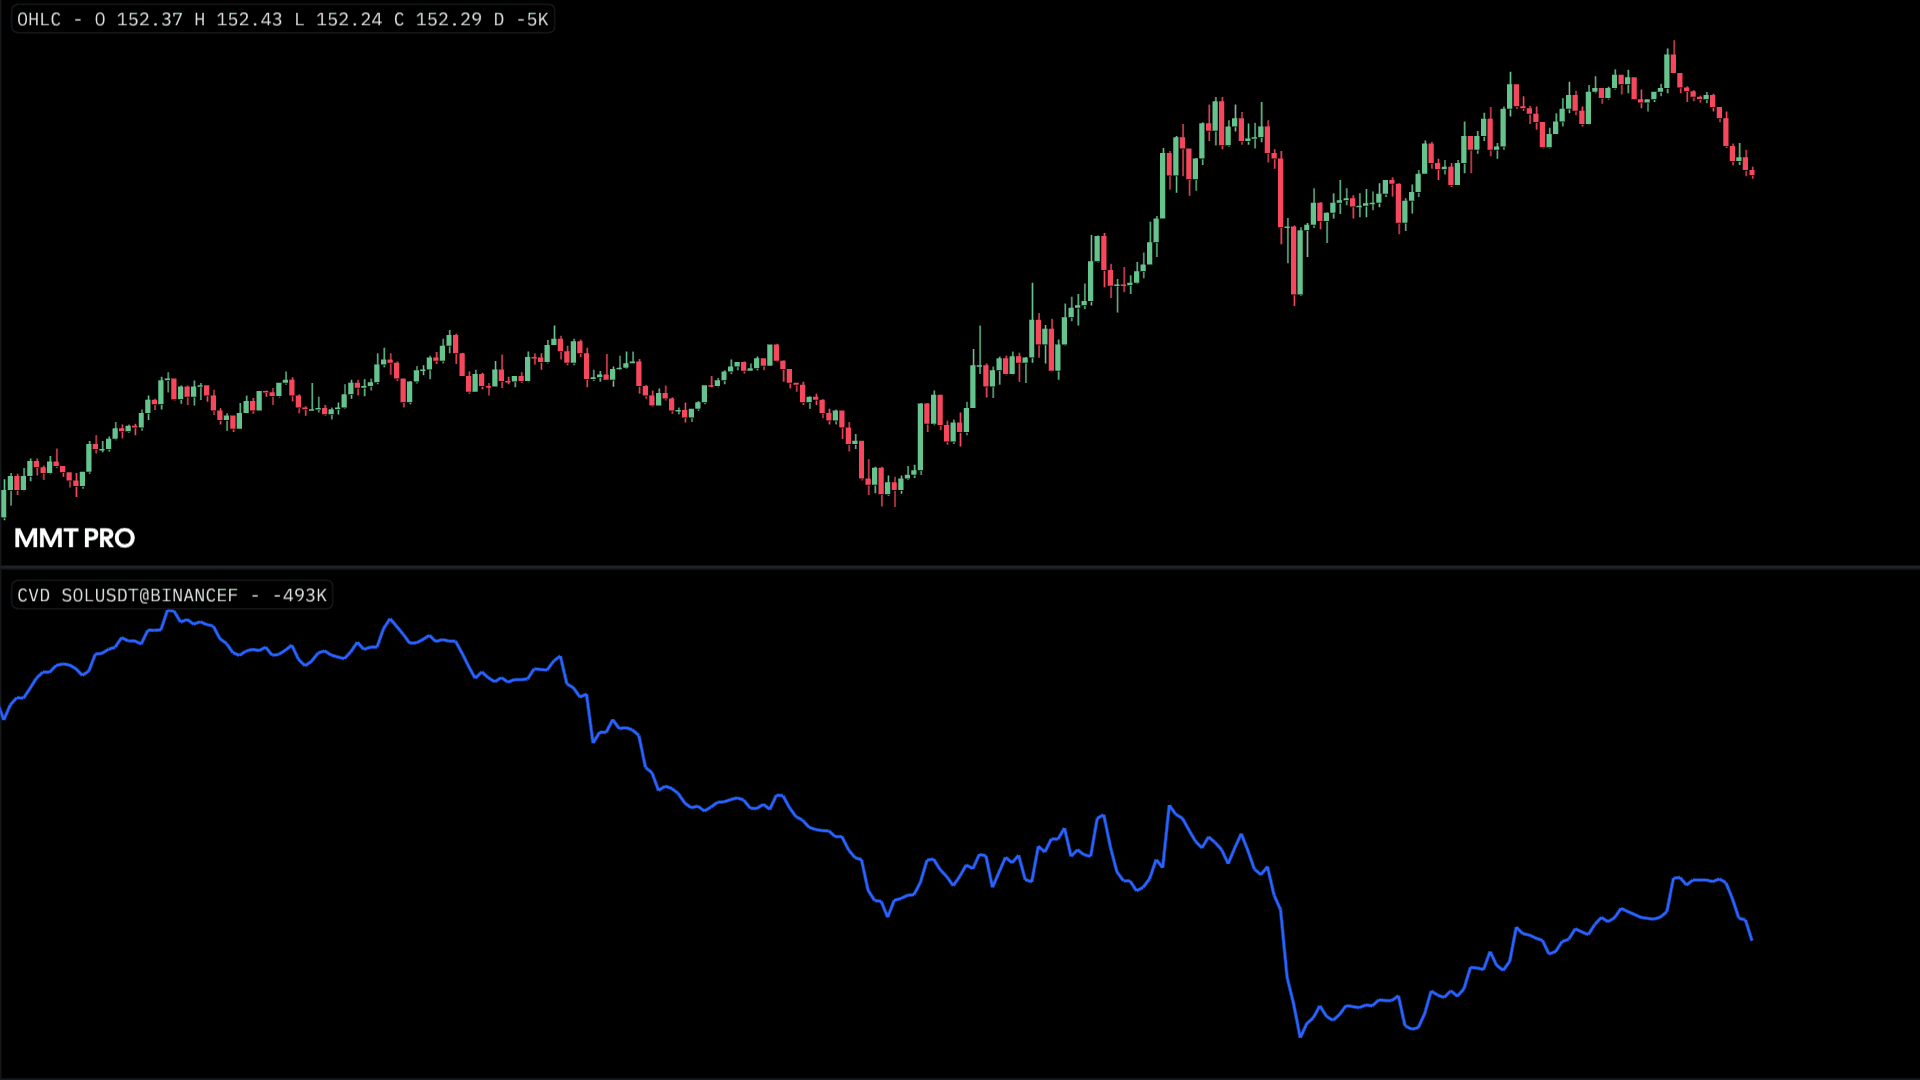
← Line Plot vs Candlestick →
For each candle this will produce either:
- Positive value- Comparatively higher market buy volume than market sell volume.
- Negative value - Comparatively higher market sell volume than market buy volume.

These positive and negative volume deltas are then cumulatively sequenced to produce the CVD plot. Visually representing cumulative flow of the buying and selling activity, CVD offers key insight into overall market sentiment.
← Line Plot vs Candlestick →
CVD Elements
Cumulative Volume Delta by default, is visually displayed as a line plot underneath your chart. When combined with price, CVD becomes a powerful tool to assess market sentiment as a whole by directly comparing volume in relation to actual movements in price.
Crucially when making these comparisons of price versus CVD, you may be able to identify and determine exhaustion & absorption.
Exhaustion
Exhaustion can be identified when: Price makes a higher high or lower low... & CVD diverges from price and fails make a higher high or lower low.
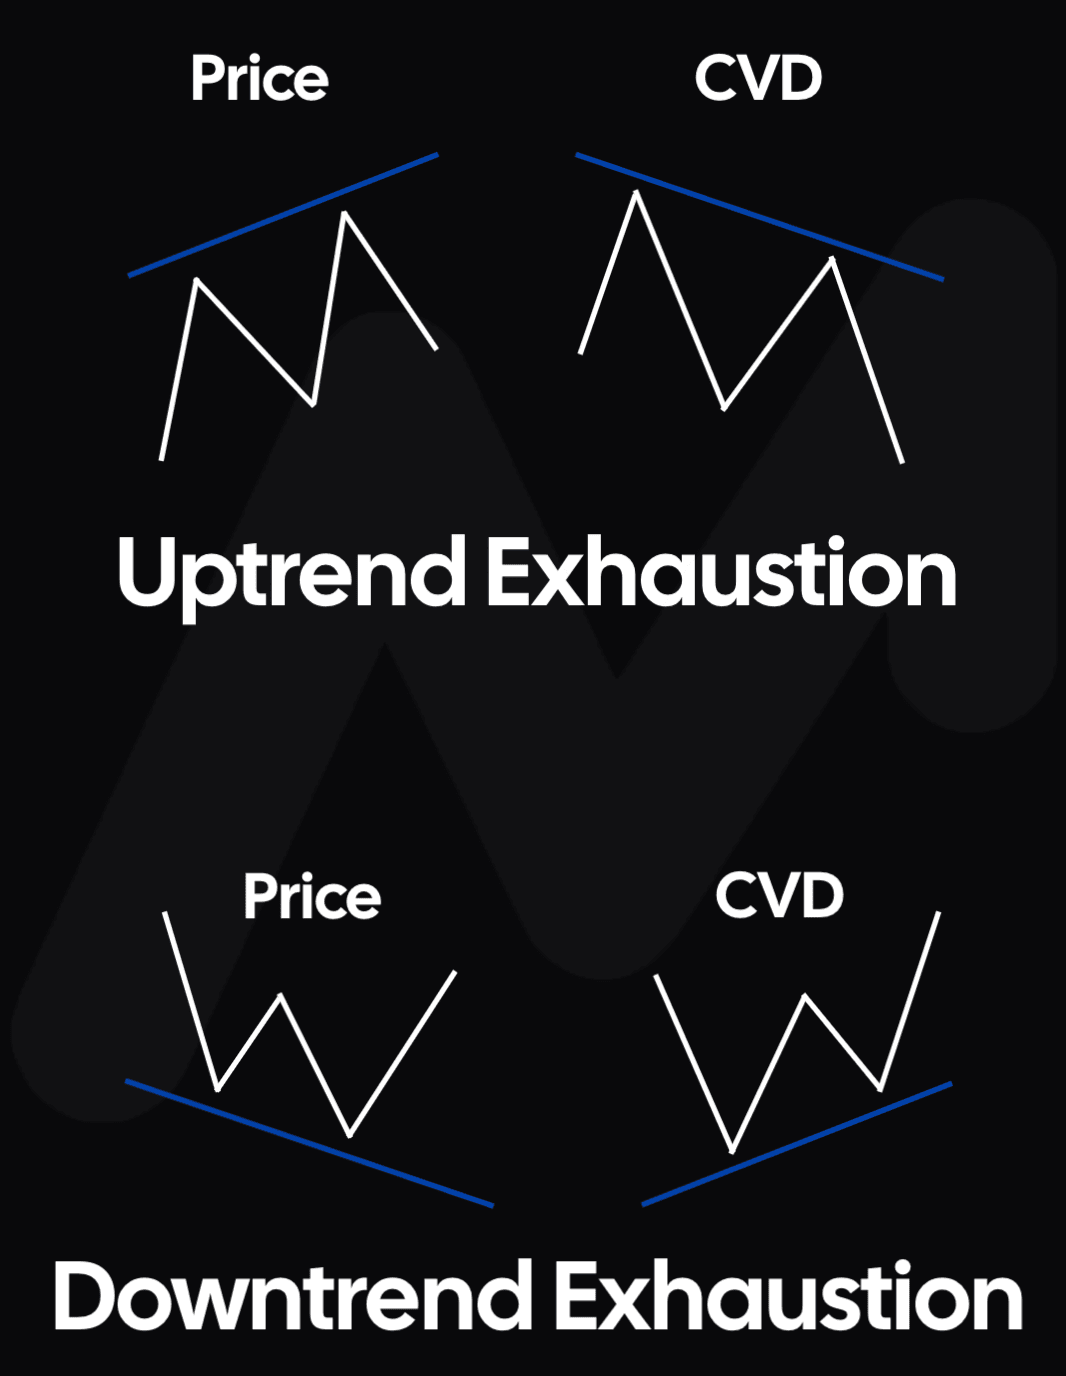
Despite price continuing in the same direction, this new higher high, or lower low, was achieved with comparatively less volume delta. The reduction in volume delta indicates 'exhaustion' from those placing market orders and critically could be an early indication of price reversal.
Absorption
Absorption can be identified when: Price makes a lower high or higher low... & CVD diverges and continues to make a higher high or lower low.

Despite price failing to continue in the same direction, this new lower higher high, higher low, was achieved with a comparatively larger volume delta. Despite the increased market order volume, as price did not follow, this would indicate 'absorption' by large limit orders, and again could be an early indication of price reversal.
These 'divergences' with price itself are key to effective use of the CVD / Cumulative Volume Delta indicator.
Aggregated CVD
The CVD layer typically calculates its values using the trading pair currently displayed on your chart. However, MMT gives you the ability to aggregate data from multiple pairs across different exchanges, offering the ability to hand-select data sources.
Within the layer settings under the 'Aggregate' section, you may selectively enable or disable individual trading pairs to determine which components contribute to the CVD metric. The CVD layer will immediately recalculate and update in real time to reflect any modifications made.
For quicker adjustments, use the 'Spot' and 'Perps' toggles to instantly include or exclude all supported pairs from each market type.
Activating CVD
To activate, head over to the "indicators" tab and select CVD. Once activated, CVD will be shown as an underlay within it's own dedicated pane.
CVD Configuration & Settings
There are two distinct configuration options within the CVD layer.
Plot Style
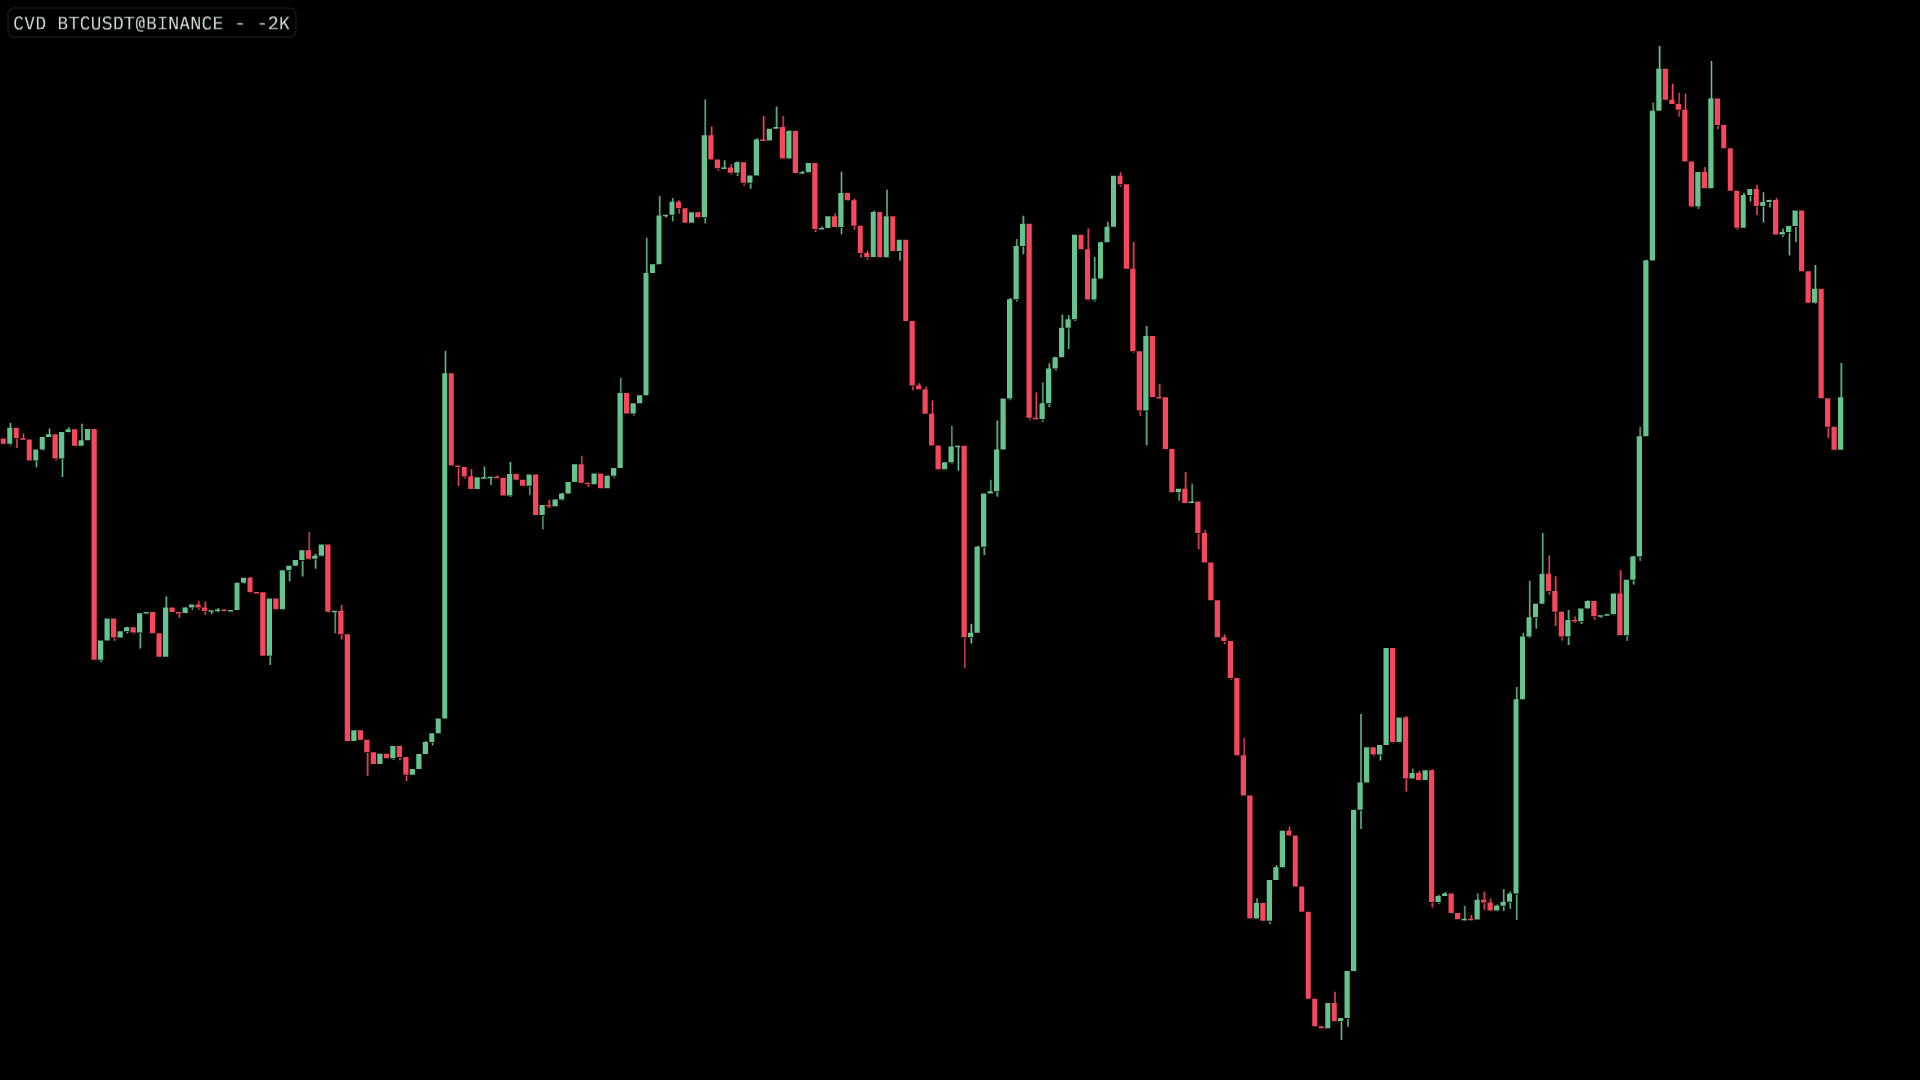
Candlestick By default, the CVD layer will be displayed as within a candlestick plot. The primary benefit of the candlestick plot is that the full rotation of delta is displayed. Within this plot style you have various options to configure the styling of the candlesticks.
Line Plot
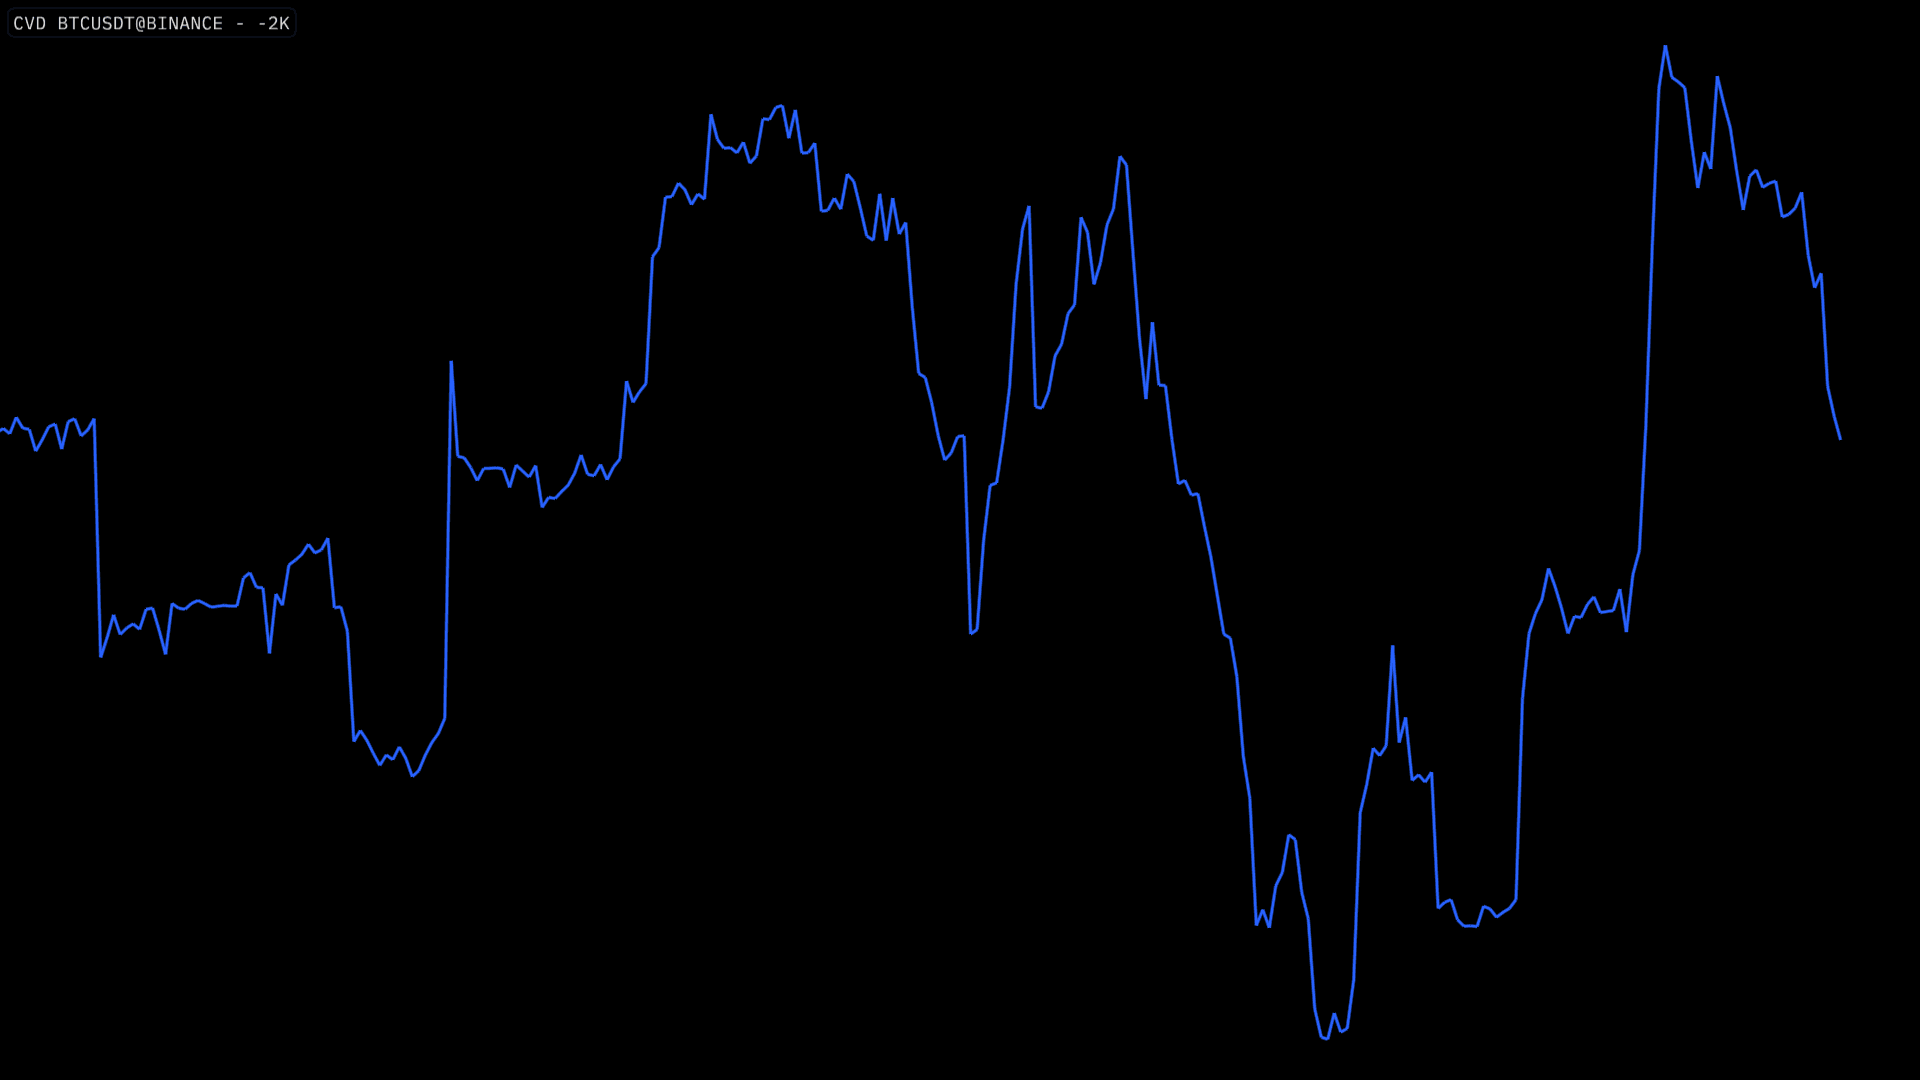
By default, the CVD layer will be displayed as a simple line plot. Whilst simple, the line plot is an effective methods to be able to spot divergences between price and CVD itself.
Delta Volume Histogram Mode
Selecting the 'Histogram Mode' will convert the Line plot explained above, into a histogram with 0 as a base-line. As before, the volume delta between market buy and market sell volume is calculated, however, the cumulative aspect is entirely removed. This in effect, is a volume delta histogram.
- Positive Deltas - Shown in Green above 0 - indicate where market buy volume was greater than market sell volume
- Negative Deltas - Shown in above 0 - indicate where market buy volume was greater than market sell volume